Download PDF
Download page Hinge Point Only Control.
Hinge Point Only Control
The next type of navigation dam operation is hinge point control. This is similar to pool control. The main difference is that instead of the water surface targets being located right at the face of the dam, the water surface targets are located some distance upstream. Figure 14-32 shows the Hinge Point Only editor. (Hinge point control is selected by clicking on the drop down box near the top right of the editor.)
In this example, the navigation dam is located at river station 714.35, and the hinge point is located at river station 728.28. The program will adjust the gates at the dam in order to maintain an approximate water surface of 645.5 feet (the target water surface) at river station 728.28. The target water surfaces and Flow Factors behave the same as for pool control. A flow monitor location is still needed. It should be located an appropriate distance upstream of the hinge point. For this dam, it is located a few hours upstream at river station 750.1.
The Steady Profile Limits Table is an optional feature (see Figure 14-32). It can make the navigation dam operations more robust for rapidly changing flow. It addresses the situation where the water surface for a given flow at the dam diverges significantly from the water surface that would be expected at the dam for a steady state, uniform flow condition.
A typical example is the trailing end of a high flow hydrograph. For instance, the flows at the hinge point and monitor location may have fallen considerably below the Open River condition, but the water surface at the dam is still a little high (compared to the flow). When the program computes a desired flow at the dam, e.g. 10,000 cfs, it adjusts the gates to get this flow. Over the next six hours, however, as the water surface at the dam continues to fall toward a lower equilibrium, the discharge can drop significantly below 10,000. This means that the navigation dam response is either sluggish in returning to the target water surface at the hinge point and/or the gates have to be changed more frequently. This is where the table becomes useful.
The data in this table give the water surfaces at the dam that will produce the target water surfaces at the hinge point for steady state conditions. For this navigation dam, it is desired to keep the water surface at the hinge point between 645.35 and 645.65 feet (Minimum and Maximum values from the water surface elevations table). If, for instance, there is a long term (steady state) flow of 10,000 cfs between the hinge point and the dam, then maintaining a water surface at the dam of 645.19 feet will result in a water surface of 645.35 feet at the hinge point. Similarly, a water surface of 645.59 at the dam will result in a water surface of 645.65 feet at the hinge point, for the same 10,000 cfs flow. The user can generate these profile limits by putting together a steady flow run from the dam up to the hinge point location. An iterative process of forcing elevations at the dam and computing them at the hinge point is required. The user must find the elevations at the dam that will get to the high and low hinge point elevations from a steady flow backwater computation. Then the values used at the dam to produce the max and min at the hinge point should be entered into this table.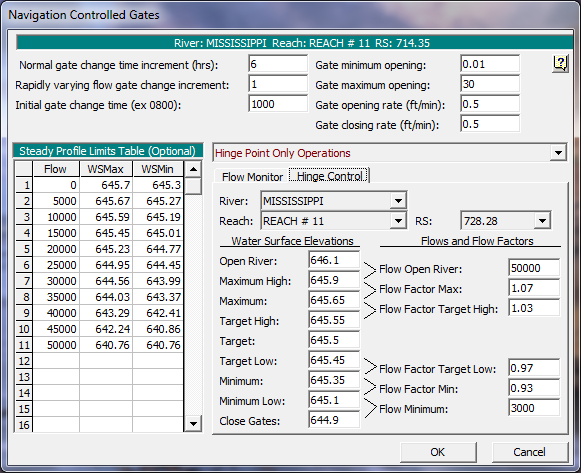
Figure 14 32. Navigation Dam Editor with Hinge Control
Continuing on with the 10,000 cfs flow example, before the program starts to iterate, it checks the current water surface at the dam against the table. If the current water surface is between the limits (in this case 645.19 and 645.59), the program continues normally as it would if the table was not being used (that is, the user had left it blank). However, let's assume that the water surface at the dam is 646.0 feet. This would mean that the water surface at the dam is above the limits. In this case the program will temporarily assume a headwater of 645.59 feet at the dam and determine the gate settings that will result in a discharge of 10,000 cfs for this lower, assumed, headwater. After this has been done, the program will use the new gate setting and continue on normally. This gate change will result in the flow at the dam initially being above the 10,000 cfs target. However, as the water surface at the dam drops, the flow should also drop down towards the 10,000 cfs range. This will, hopefully, produce a faster response without over shooting the target water surface at the dam.
If the water surface is on the low side, it works the same way except the lower limit is used. If the water surface at the dam were 645.0 then the gate setting would be based on an assumed water surface of 645.19. The profile table is optional and can be left blank. However, it can produce a better response, at least for some data sets. That being said, it should also be noted that the table will not perform as well when the flow at the dam is being heavily influenced by tailwater conditions.