Download PDF
Download page Example of Georeferencing an HEC-RAS Model.
Example of Georeferencing an HEC-RAS Model
In this example the Baxter River dataset will be used demonstrate how to georeference an HEC-RAS model. Specifically, the River Network, Cross Sections, Storage Areas, and Storage Area connections, shown in the figure below, will be georeferenced using methods in HEC-RAS and using the GIS.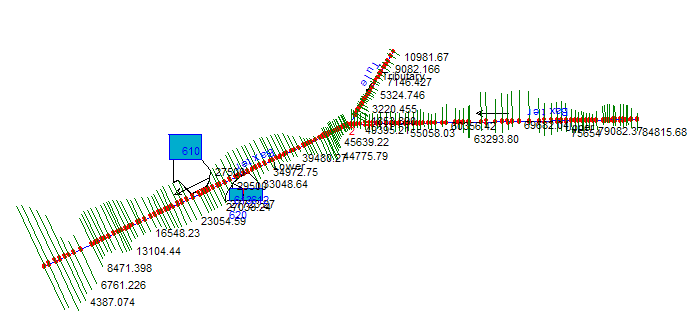
A non-georeferenced model schematic.
To successfully georeference a RAS model, you decide on a coordinate system and have at least one background dataset that has been projected to that coordinate system. A digital raster graphic (DRG) of a topographic quad sheet, an aerial photograph, or a digital terrain model (DTM) may be available for reference.
Once the coordinate system has been defined and a background dataset acquired, you should establish the stream centerline first. Georeferencing the river network will assist you in spatially locating the cross sections.
The river network may be created in either the GIS using HEC-GeoRAS or created directly in HEC-RAS; however, you will not have access to production level digitizing tools in HEC-RAS so this option is limited to very simply river networks.
Creating the River Network using HEC-GeoRAS
Open ArcMap and load the 3D Analyst and Spatial Analyst Extensions. Turn on the HEC-GeoRAS toolbar and Save the ArcMap document.
Set the Coordinate System for the data frame (map) and load the background data (image, DTM, etc). The GeoRAS tools for establishing the Stream Centerline topology require that you load a terrain model.
The Stream Centerline is used to establish the river reach network and is shown in Figure 5-103. The river network must be digitized in the direction of flow with reach end points coincident at junctions.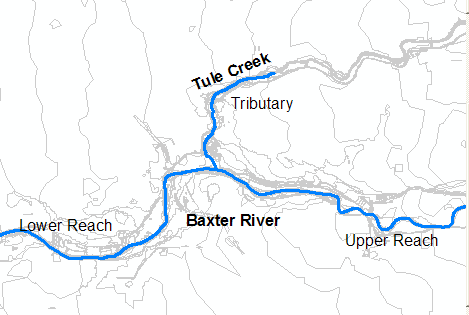
Figure 5 103. River network for the Baxter River example dataset.
Digitize the stream centerlines for the river reaches shown. From the GeoRAS toolbar, select the RAS Geometry | Create Layer | Stream Centerline menu item.
Start editing the feature class by selecting the Editor | Start Editing menu item. The stream centerline must be created in the direction of flow, so start at the top end of the river and zoom in so that the channel is easily identified.
Select "Create New Feature" for the Task and "River" for the Target feature class. Select the Sketch tool and begin digitizing the line in the downstream direction. (Left-click drops a vertex.) Continue digitizing the line until you reach the junction. If you need to pan, simply select the Pan tool, pan through the map, and re-select the Sketch tool to continue digitizing. To finish the reach line at the junction, double-click to drop the endpoint.
Digitize each river reach, individually. There are three river reaches in total, with one junction at the confluence of Tule Creek. You will create the junction after creating all the reaches.
Creating a Junction. To create a junction, the endpoints of each reach must be coincident. While in Edit mode, select "Modify Features" for the Task. Next set the snapping tolerance, by selecting the Editor | Options menu item. On the General tab, set the Snapping Tolerance to "10" map units.
Next select the Editor | Snapping menu item. Click on snapping to the End points for the River layer, as shown Figure 5-104.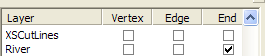
Figure 5 104. Select the option for snapping at end points
Next, select the Edit tool and grab the endpoint of a river reach line by pressing and holding the left mouse button. Move it towards another reach endpoint. When the point is within the snapping tolerance, a sketch of the endpoint will appear and snap to the endpoint. Release the mouse button and the endpoint will snap. The progression of steps to snap endpoints in illustrated in Figure 5-105. 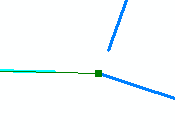
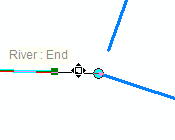
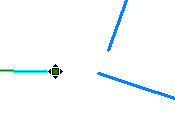

Figure 5 105. Progression for creating a junction using snapping.
Repeat the snapping process for the other reach. Verify that the reach network has been created in the downstream direction by changing the line symbol to include and arrow at the end of the line. In a later step, you will use the GeoRAS tools to double-check the connectivity.
River and Reach Names. Each river must have a unique river name, and each reach within a river must have a unique reach name. Use the ![]() (River Reach ID) tool to give each river reach a name.
(River Reach ID) tool to give each river reach a name.
Click on the River Reach ID tool to make it active. Use the cursor to select each river reach. The River and Reach Name dialog (shown in Figure 5-106) will appear allowing you to enter the river and reach name. For this example, the Baxter River has an Upper Reach and a Lower Reach and Tule Creek is a Tributary.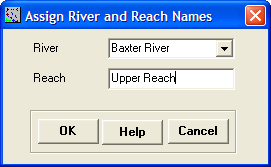
Figure 5 106. River and Reach name assignment dialog.
After labeling each River reach, look at the attributes for the River layer and verify that the River and Reach information was provided for each reach. To open the attribure table, right-click on the River layer and select the Open Attribute Table menu item.
Network Connectivity. To verify the river reach connectivity, select the RAS Geometry | Stream Centerline Attributes | Topology menu item. The fields FromNode and ToNode will be populated with integer data. Verify that the endpoints at the junction all share a common node number. The complete attribute table for the River layer is shown in Figure 5-107.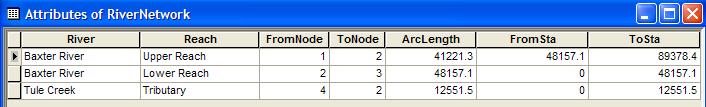
Figure 5 107. Completed Stream Centerline attribute table.
Lastly, run the RAS Geometry | Stream Centerline Attributes | Lengths/Stations menu item. This computes the length of each reach for determining the cross-section river stationing. The FromSta and ToSta fields will be populated with the FromSta being the downstream endpoint of the reach. The FromSta and ToSta data are "backwards" from the FromNode and ToNode because the actual river stationing is calculated from downstream to upstream!
Export the data by selecting the RAS Geometry | Extract GIS Data menu item. The dialog shown in Figure 5-108 will be invoked allowing you to choose the destination directory and filename. 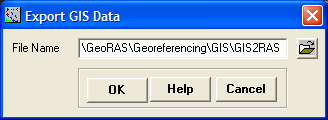
Figure 5 108. Filename and location for GIS export.
After pressing OK, GeoRAS will export the GIS data to an XML file and then convert the XML file to the SDF format. Two files will be created: "GIS2RAS.xml" and "GIS2RAS.RASImport.sdf". This process will take several seconds. The dialog shown inFigure 5-109 will appear when the process is has successfully created the files. You now have a file you can import into your RAS model.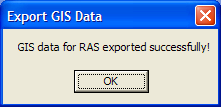
Figure 5 109. Successful GIS data export dialog
Creating the River Network using HEC-RAS
If you don't have access to GIS tools or your river network is very simple, creating the river network in HEC-RAS is an option. To get started, open the RAS project that needs to be georeferenced.
Open the Geometric Data editor and create a New Geometry File. Add the background data by clicking on the Add Background Data ![]() button. If the image does not come in correctly, select the View | Set Schematic Plot Extents menu item and press the Set to Computed Extents button in the Geometry Extents window shown in Figure 5-110. This will zoom out the bounds of the image.
button. If the image does not come in correctly, select the View | Set Schematic Plot Extents menu item and press the Set to Computed Extents button in the Geometry Extents window shown in Figure 5-110. This will zoom out the bounds of the image.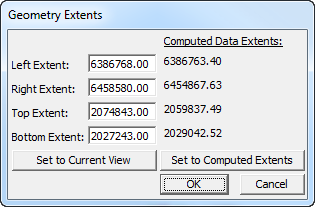
Figure 5 110. Dialog for setting the display extents in HEC-RAS.
Press the OK button to use the new extent coordinates and to dismiss the window.
Select the River Reach creation tool and digitize the Baxter River. You will want to be zoomed in to a reasonable scale. Digitize the centerline of the river in the downstream direction. You can pan by right clicking. This will pan the display window so that the mouse is centered.
After double clicking to end the river the dialog shown in Figure 5-111 will be invoked to provide you a place to enter the River and Reach name.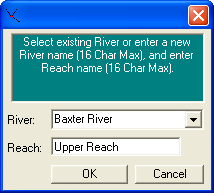
Figure 5 111. River and reach name data entry dialog.
Create the Tule Creek Tributary. Make sure to end the line on the Baxter River at the confluence. You will then be asked if you would like to split the Baxter River. Select Yes and provide a reach name for the Lower Reach of the Baxter River. Next, provide a junction name.
Save the geometry. You will now have an HEC-RAS geometry that has a georeferenced River Network like that in Figure 5-112. This can be imported into an existing RAS geometry.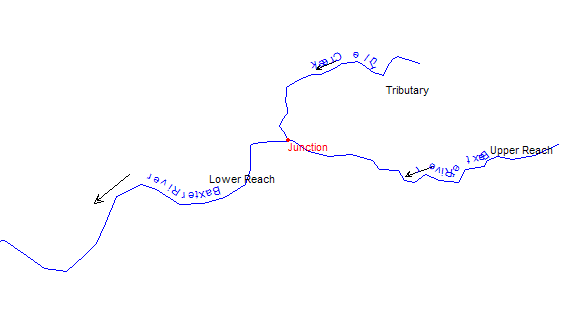
Figure 5 112. A georeferenced river network in HEC-RAS.
Importing the Stream Centerline
Once you have an import file created using GeoRAS or a geometry file created in RAS with a georeferenced stream centerline, you can import the stream centerline from either the GeoRAS export file or the RAS geometry file. The RAS Geometric Data importer works the same for either file.
Open HEC-RAS and load the non-georeferenced geometry shown in Figure 5-113. Save the geometry to a new geometry so that if anything goes wrong you won't destroy your existing model data.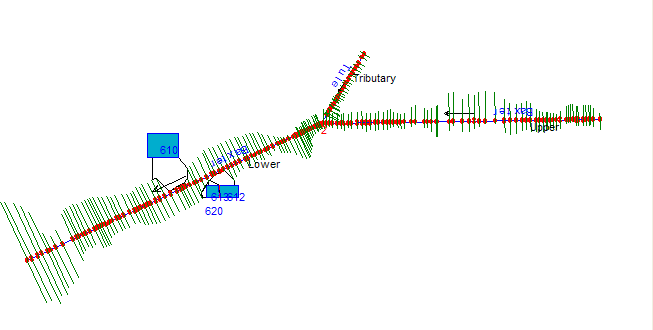
Figure 5 113. A non-georeferenced appears as a stick diagram in HEC-RAS.
Select the File | Import Geometry Data | GIS Import menu item. Select the RASImport.sdf file to import created using GeoRAS. (If you created the centerline in a RAS geometry file, select File | Import Geometry Data | HEC-RAS Format instead and choose the geometry file.)
HEC-RAS may display a warning or error message because it is expecting cross section data and the file only has the river network information. Continue through the error message.
Click on the River Reach Stream Lines tab. Note that the importer, as shown in Figure 5-114, thinks that the river reaches are all "new".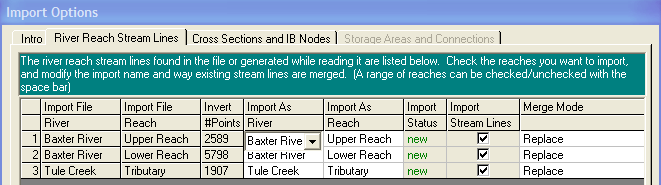
Figure 5 114. The HEC-RAS geometry importer looks to match the names in the import file with names in the RAS geometry file.
HEC-RAS thinks that the river reaches are new because the names in the import file do not match those that are in the existing RAS model. Select the appropriate names to import the river and reaches to by using the list boxes in the Import As columns. When completed, the Import Status will change to "exists", as shown in Figure 5-115.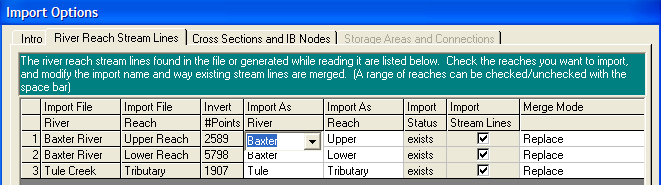
Figure 5 115. When river and reach names in the import file and geometry file match, the import status is "exists".
You are now ready to import the stream centerlines. Press the Finished-Import Data button. The stream centerline will import, replacing the existing river network. The HEC-RAS model will no longer look like a stick diagram, but will look georeferenced with a river network like that in Figure 5-116.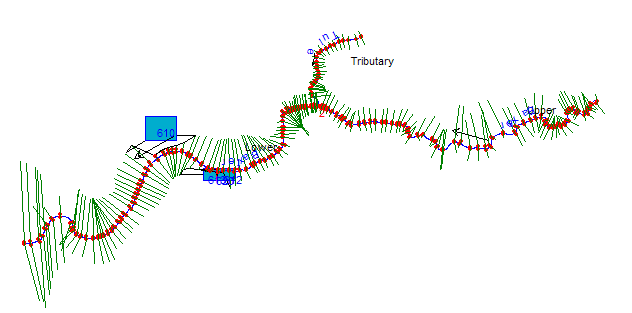
Figure 5 116. An HEC-RAS model with a georeferenced river network.
The cross sections look like they could be georeferenced, but they are not. They are actually drawn perpendicular to stream centerline and are spaced based on the channel downstream reach lengths. You can verify that the cross sections are not georeferenced by looking at the Cut Lines table. Select the GIS Tools | XS Cut Lines Table menu option. In the river station list box there is a label of "NO DATA!!" after each river station (see Figure 5-117).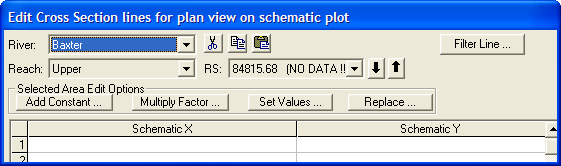
Figure 5 117. Cross sections without cut line information display "NO DATA!!" in the river station list.
Note that the storage areas are also not georeferenced. We will complete the remainder of the georeferencing within the HEC-RAS Geometric Data editor.
Storage Areas and Connections
Load the background image using the Add Background Data button and turn it on. Let's georeference the storage areas first.
Zoom into the area around the storage area on the north side of the river. Use the line creation tool available in RAS to create the outline of where the storage area should be. The line creation tool becomes active in any display in RAS when you press the Ctrl key.
Press the Ctrl key, while depressed, left-mouse click around the area that the storage area represents. When the polygon is completed, release the Ctrl key. The dialog shown in Figure 5-118 will be displayed summarizing some of the line information and the x and y coordinates will be copied to the clipboard. Press the OK button to continue.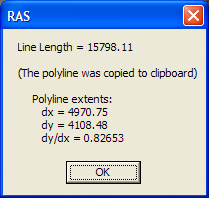
Figure 5 118. Summary dialog from the line creation tool.
Now you need to paste the spatial information into the storage area table. Select the GIS Tools | Storage Area Outlines Table. The table shown in Figure 5-119 will open with the previous outline information.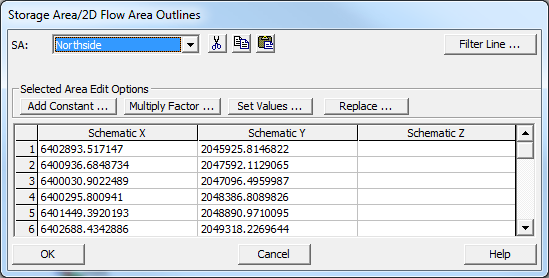
Figure 5 119. Storage area outline information.
Select the entire table by clicking in the upper left hand corner of the table, as shown in Figure 5-120, and paste the information using the Ctrl+V paste command. The coordinates of the line you create will replace the previous data. Press OK to accept the changes.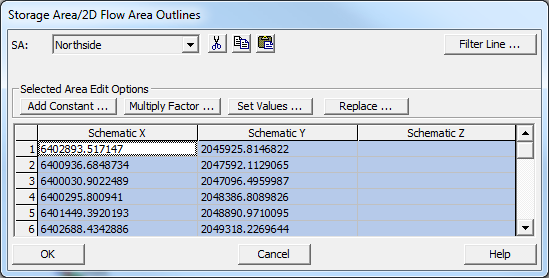
Figure 5 120. Storage area outline information replaced with georeferenced data.
Georeference each storage area as you did for the first. The storage areas should finally look like those in Figure 5-121.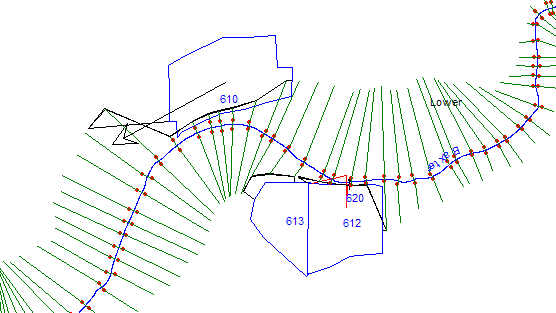
Figure 5 121. Geometric schematic with georeferenced storage areas.
Note that the storage area connection on the south side of the river is not georeferenced. You can georeference it the same as with the storage areas. Use the line creation tool to draw a line between the storage areas. Paste the results in the Storage Area Connections Lines Table accessible from the GIS Tools menu and the storage area connection will be drawn between the storage areas (see Figure 5-122).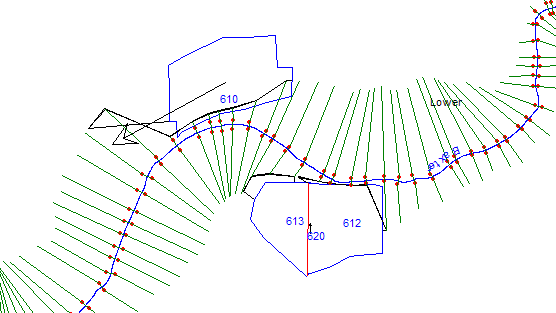
Figure 5 122. Geometric schematic with a georeferenced storage area connection.
Cross Sections
As discussed previously, the cross sections may look georeferenced, but they are not. Cross sections that do not have geospatial information are drawn perpendicular to the stream centerline and the spacing is based on the downstream reach lengths.
By default, the Geometric Schematic scales the display of the cross sections based on the river network. This is handy when the data is not georeferenced (when the river schematic is very short when compared with real world distance), but we want to turn this option off when we georeference the cross sections. Select the GIS Tools| Scale Cut Lines to Reach Lines menu item, as shown in Figure 5-123, to remove the check.
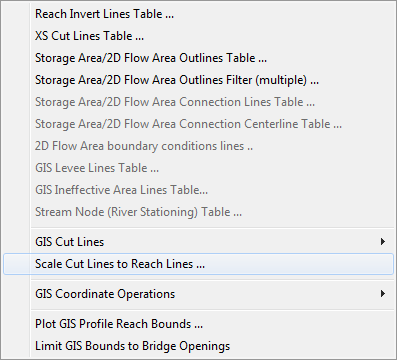
Figure 5‑123. The Scale Cut Lines to Reach Lines menu item should be unchecked when using georeferenced data.
Cross sections should be georeferenced first at locations where you have a pretty good idea where they should go. The hydraulic structures in your model are the place to start. If you do not have bridges in your model, you should start by locating where the most downstream and most upstream cross sections are located. This will allow HEC-RAS to establish where the cross sections should be along the river using the channel downstream reach lengths.
For this example, we are going to start with the most upstream bridge on the Upper Reach of the Baxter River. As shown in Figure 5-124, the bridge sections are located approximately 3000 ft upstream of the bridge and will need to be moved to the correct location.
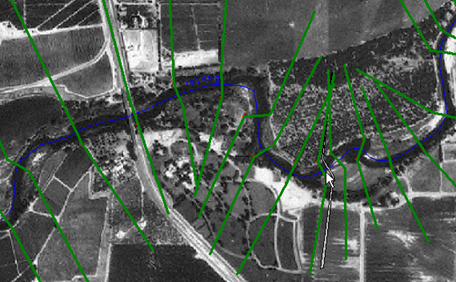
Figure 5‑124. The bridge sections are upstream of the real world location.
Use the mouse to left click on the downstream bridge cross section and select the Move Cut Line Upstream/Downstream option. The selected cross section and river centerline will be highlighted. Next, use the crosshairs and left click on the stream centerline just downstream of the bridge. The cross section will be repositioned (see Figure 5-125) and RAS will georeference it based on the stream centerline, cross section width, and bank stations.
The model schematic will then update to reflect the changes to all the cross sections based on the position of the georeferenced cross sections. A message will appear at the bottom of the schematic explaining to the user that all the cross sections do not have GIS information. The georeferenced cross sections are green, while those without geospatial data will be brown.
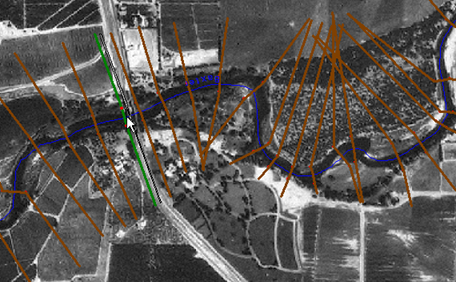
Figure 5‑125. The downstream bridge location has been georeferenced.
The downstream bridge cross section is not exactly where it should be, so use the edit tools to move the endpoints of the cross section. Select the Edit | Move Object menu item. This will place vertices on each cut line, as shown in Figure 5-126, and allow you to move the points using the mouse. Move the points on the downstream bridge cross section.
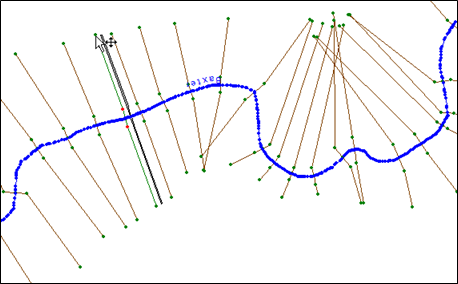
Figure 5‑126. Vertices are display on the cut lines while in Move Object mode.
Do the same for the cross section on the upstream side of the bridge (see Figure 5-127), as well. Note that as soon as you move a point on a cross section that is not georeferenced it becomes georeferenced!
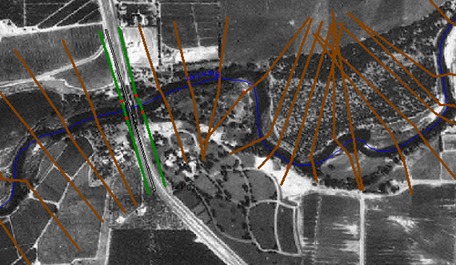
Figure 5‑127. The upstream and downstream bridge cross sections have been georeferenced.
HEC-RAS will use the main channel reach lengths for determining where to lay out the cross sections, however, the stream centerline you created for georeferencing the model may not be identical the centerline used when the river hydraulics model was first created. So you need to continue to position cross sections with known locations.
Zoom into the RAS schematic to the bridge just upstream from the airport runway. Note that the bridge river station position is about right on (see Figure 5-1286). It was placed there based on the downstream reach length. But to properly model this bridge, the cut line must follow the bridge out to high ground. Therefore, the cut line had to bend to follow the road. In this case, just moving the cut line points would be more difficult that using the line creation tool. Use the line creation tool to draw a line where the downstream bounding bridge cross section should be located.
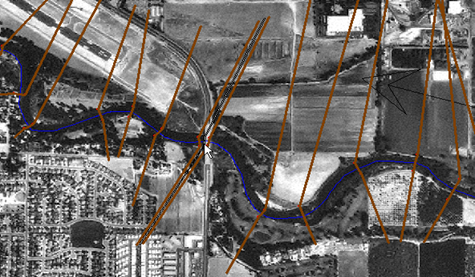
Figure 5‑128. Bridges not perpendicular to the river require moving the bounding sections.
Once you have copied the cross section to the clipboard, paste it into the cut line table shown in Figure 5-129, as accessed through the GIS Tools | XS Cut Lines Table.
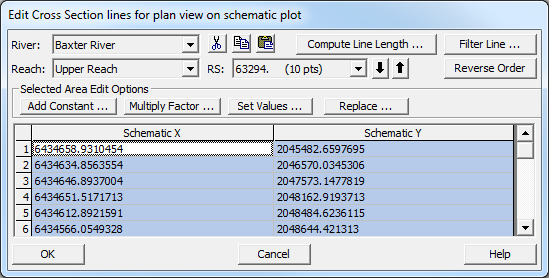
Figure 5‑129. Cross section cut lines table data.
Press OK to accept your edits and the cross sections will look like those shown in Figure 5-130.
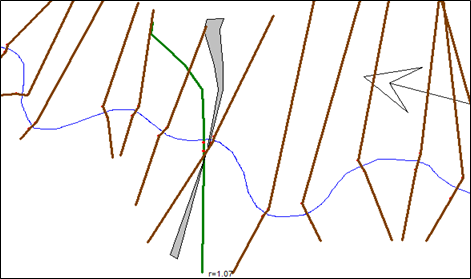
Figure 5‑130. The ratio of the cut line to cross section width is displayed next to the cross section (r=1.07).
The downstream bridge cross section is now georeferenced, but there are two key pieces of information displayed that show you a mistake (1) the bank stations are not on either side of the stream centerline and (2) the ratio of the cut line to cross section width is 1.07 [r=1.07]. You need to adjust the cut line by shortening the left side. Use the Edit Object mode to move the left endpoint in until the banks are positioned correctly and the ratio is 1. The display of the cut line to cross section ratio is turned on/off through the View | Display Ratio of Cut Line Length to XS Length menu item.
What happens if the bank positions move to the correct position but the ratio remains greater than 1? Move the right bank in. The GIS Tools | GIS Cut Lines | Adjust Cut Line Lengths to Match Sta/Elev option can also be used to adjust the cut line lengths.
Obviously, the next step is to georeferenced the cross section just upstream of the bridge. Again, use the line creation tool and paste the cut line information into the cut line table. Adjust the cut line as necessary to look like Figure 5-131.
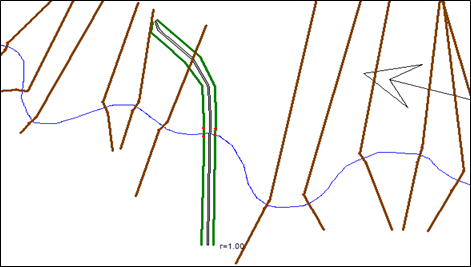
Figure 5‑131. The downstream and upstream cut lines have been georeferenced.
It looks like there are some problems with how cross sections intersect near the bridge. We will need to remedy that problem of cross section intersecting. Not only hydraulically incorrect but attempts to perform floodplain delineation will not be successful. Prior to fixing overlapping cross sections, position all cross sections for which you know there location.
Reposition all cross sections around bridges. Next, look at any cross sections that HEC-RAS may have placed in the correct location. If any non-georeferenced cross section looks good, left click on that cross section and select the Accept Displayed Locations (as Georeferenced) menu item. This will store the cross section line to the XS Cut Lines table. If you want to accept the cut line information for more than one cross section, select the GIS Tools | GIS Cut Lines | Accept Displayed Locations (as Georeferenced) menu item and select the cross sections in the selection dialog. The color of all of the cross sections will turn green. The final, georeferenced geometry will look similar to that shown in Figure 5-132. Now you can re-run the model and export the results to the GIS for floodplain mapping.
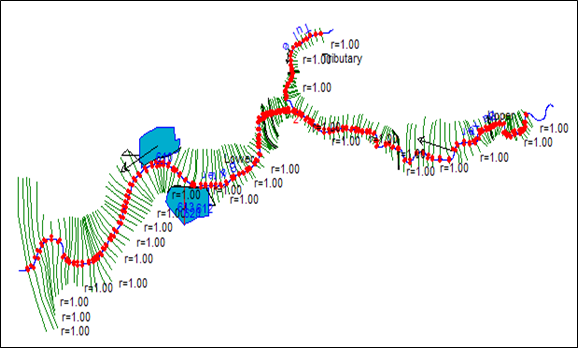
Figure 5‑132. A completely georeferenced HEC-RAS model.