Download PDF
Download page Storage Area and 2D Flow Area Connections.
Storage Area and 2D Flow Area Connections
![]()
Storage Area/2D Flow Area connections (SA/2D Area Conn) are used to link two storage areas together with a hydraulic structure, or two 2D Flow Areas, or a storage area to a 2D Flow Area. The SA/2D Area Conn tool can also be used to place a hydraulic structure in the middle of a 2D Flow Area in order to control how flow travels from one series of cells to another series of cells. The SA/2D Area Conn has three Structure Type options: 1) Weir, Gates, Culverts, Outlet RC and Outlet TS; 2) Linear Routing option (The Linear Routing option is for storage areas only, not 2D Flow Areas); or 3) Bridge (1D Family of RCs). To establish a hydraulic connection between two storage areas, 2D flow areas; or inside of a 2D Flow Area, press the "SA/2D Area Conn" button at the top of the geometric data window. Once the storage area connection drawing tool is invoked, the user simple presses the left mouse button one time to start drawing the centerline of the hydraulic structure. Continue left clicking to digitize the centerline of the hydraulic structure, then double click to end. This structure should be drawn from left to right while looking in the positive flow direction (i.e. downstream). If this structures is drawn between two storage areas, a storage area and a 2D flow area, or between two 2D flow areas, the user will need to define the From and To locations within the SA/2D Area Connection editor. If the structure is drawn completely inside of a single 2D Flow Area, then the To and From connections are automatically set to the 2D area.
Once a SA/2D Area Connection is drawn, the user must enter information describing the hydraulics of the connection. This is accomplished by pressing the SA/2D Area Conn editor button on the left hand side of the geometric data editor. When this button is pressed, the following window will appear: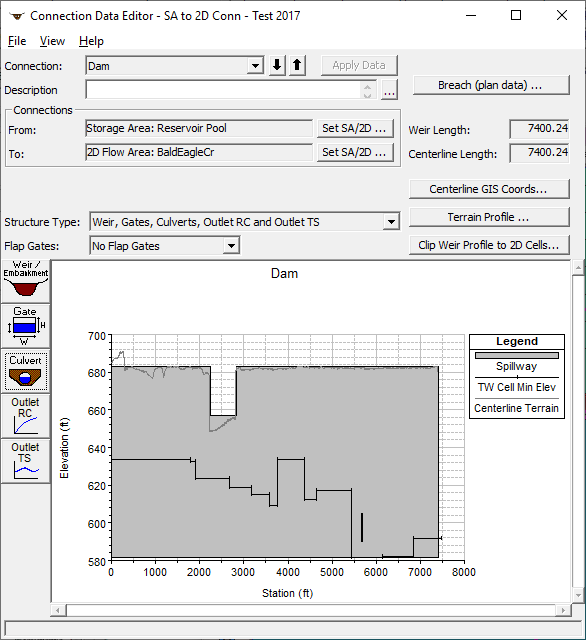
SA/2D Area Connection Editor
As shown in the figure above, this example is for a hydraulic structure connecting a storage area to a 2D Flow Area. The user should first enter a description for the SA/2D area connection. Next the From and To connections must be set correctly. After that the user should select the Structure Type from the drop down box. As mentioned previously, the user has the choice of three different structure types: 1) Weir, Gates, Culverts, Outlet RC and Outlet TS; 2) Linear Routing option (The Linear Routing option is for storage areas only, not 2D Flow Areas); or 3) Bridge (internal to a 2D Flow Area). Once a structure type is selected, the window will place editor buttons specific to that type of structure onto the left side of the editor. In this example, the default structure type (Weir, Gates, Culverts, etc.) is shown on the window.
Note: The user also has the option to perform a breaching analysis of any SA/2D Flow Area connection. The breach data is stored in the currently opened Plan, however, the user can get to the breach editor by pressing the button labeled "Breach (plan data)" on this editor. Breach information for a SA/2D Flow Area is the same as for a Dam or a levee breaching analysis.
Weir Embankment Editor
The user must enter data for the Weir/Embankment editor at a minimum. The other editors (gates, culverts, rating curves, and time series outlet) are optional. In this example data was entered for weir/embankment and Culverts. When the weir/embankment editor is selected, the window shown below will appear.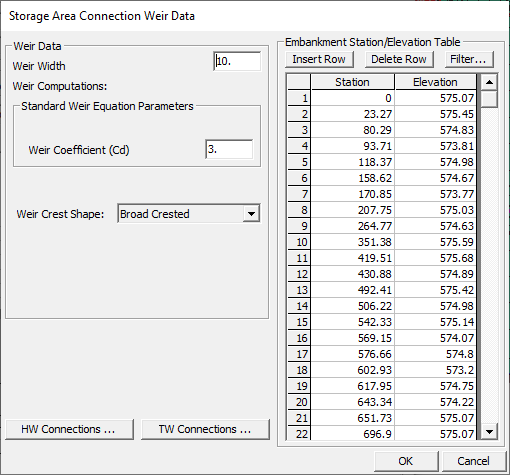
Weir/Embankment Editor for Storage Area Connections
To complete the data for the weir/embankment, the user enters a Weir Width (used only for drawing the schematic); a Weir Coefficient (used in the weir flow calculations); a Weir Crest Shape (used to assist in the calculation of the weir coefficient, as well as defining submergence criteria); and the Station/Elevation Points that describe the top of the weir/embankment profile. The weir/embankment can have up to 500 points to describe the profile. The program will use all of the information entered by the user for calculating weir flow between the two storage areas. After all of the data is entered, simply press the OK button to have the data accepted by the program.
Culvert Data Editor
When the culvert editor button is selected, the following window will appear.
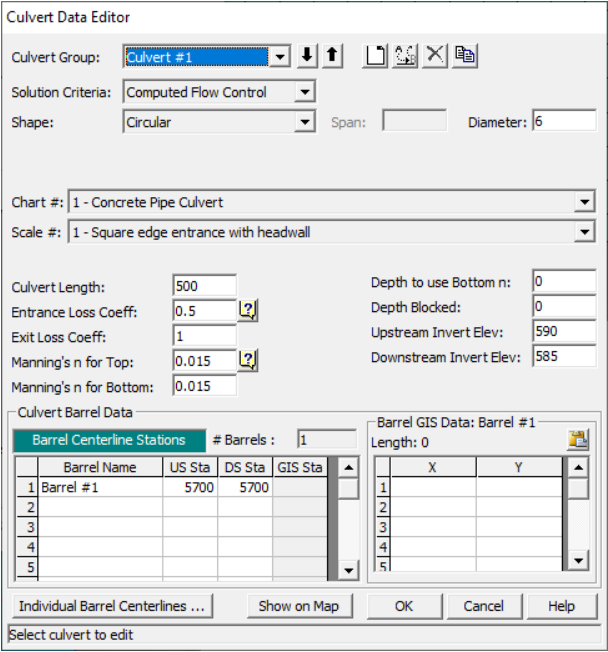
The culvert editor shown above has exactly the same information as the normal culvert editor used at a 1D river crossing. For detailed information about this editor, please review the Bridge/Culverts section found earlier in this document.
If the user is connecting Culverts to 2D Flow Areas, it may be advantageous to define coordinates for each of the culvert barrels. This will allow you to connect the ends of a barrel to a specific cell. In the Culvert Data Editor there is a button on the lower left portion of the editor labeled "Individual Barrel Centerlines". This new button opens the Edit GIS Data Table editor, for entering the X and Y coordinates for the centerline of each culvert barrel added to the model, which allow users to view the barrels spatially. [Note: Separate centerlines must be added even for identical barrels within the same culvert group, and the barrels may also be connected to different cells.]
All Culvert centerlines (as well as gates, rating curves, and flow time series outlets), must be drawn from upstream to downstream. Keep in mind that is how the original centerline of the SA/2D Area Connection is drawn which defines upstream and downstream. Therefore, when users draw the centerline for the SA/2D Area Connection, it is drawn from left to right looking in the downstream direction. Based on that convention, when the centerlines for the hydraulic outlets (culverts, gates, rating curves, etc.) are drawn, yet again the centerlines must be drawn from the upstream side of the structure to the downstream side of the structure. For the example provided in, the structure being used to model the levee was drawn from the south end of the levee to the north end of the levee. Therefore, the culverts were drawn from the right hand side of the structure (head water) to the left hand side of the structure (tailwater).
If the user presses the button labeled "Individual Barrel Centerlines" from the Culvert Data Editor, the EditGISDataTable centerline coordinate editor opens.
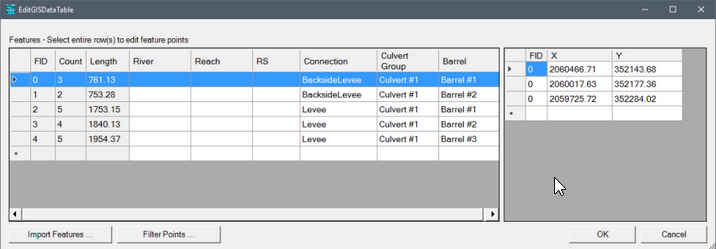
As shown in the figure below, The Feature Centerline Table contains the centerline X and Y coordinate data for all of the structures in the model. When the Edit GIS Data Table editor is opened, it will highlight the culvert that was open and selected in the Culvert Data Editor. To use this editor, from the Features table (located on the left of the editor), select a single culvert barrel (highlight it), and then past in the X and Y coordinates for the barrel into the data table (on the right hand side of the editor). Hint: The easiest way to define the culvert barrel X and Y centerline coordinates is to go back to the Geometric Data editor, hold down the Ctrl key, and digitize the culvert barrel centerline from the headwater side of the structure to the tailwater side of the structure. This digitized line can be copied to the clipboard from the Measure Line editor that pops up once digitizing the line is complete. Once all of the barrel coordinates have been entered, close all of the SA/2D Area Connection windows, and the digitized culvert(s) will appear in the Geometric Data editor window. Additionally, there is an option to import the culvert X and Y centerline coordinates at the bottom of the editor.
Note: In HEC-RAS, the process for adding centerline X and Y coordinates for individual hydraulic outlets (gates, rating curves and flow time series, etc.) is exactly the same as described above for culverts.
If the user is connecting a storage area to another storage area, an additional button will appear on the editor labeled "Htab Param". This editor is used to define the limits of the family of rating curves that will be developed for the storage area to storage area connection. When this button is pressed, the following editor will appear:
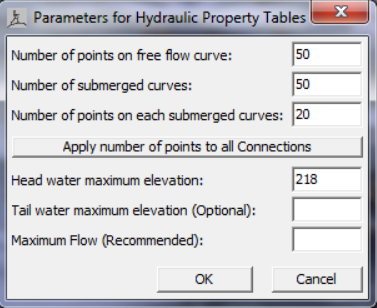
As shown in figure above, the user must enter a number of points for the free flow curve (default is 50, max 80); number of submerged curves (default is 50, max 60); number of points on the submerged curves (default is 20, max 50); and head water maximum elevation. Additionally, the user can enter a tailwater maximum elevation and a maximum flow rate. All of these parameters are used to define the limits of the family of rating curves that get created when the geometric pre-processor runs.
Gate Data Editor
If the user has decided to use the Gates option, pressing this button will bring up the window shown in the figure below. This editor is the same gate editor that is used for inline and lateral gated spillways. For information about this editor, please review the sections on inline gated spillways found earlier in this chapter.
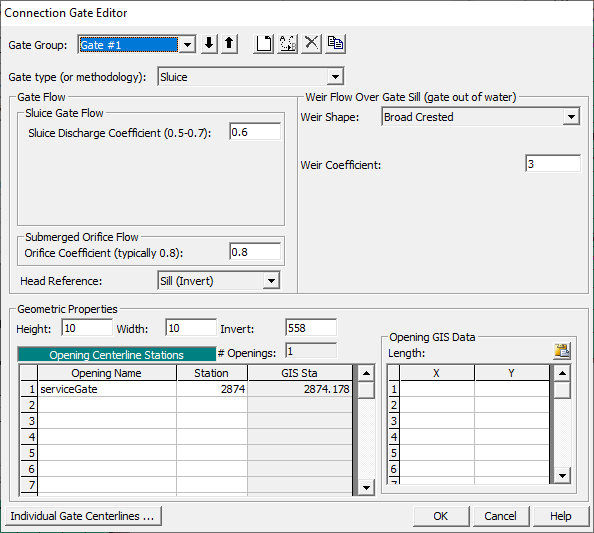
Gated Spillway Editor for Storage Area Connections
Diversion Rating Curve
Diversion rating curves are used to remove flow from a main river. The diversion, rating curve can be used in conjunction with a lateral weir, gated structures, and culverts, or it can be used alone.
To add a diversion, rating curve to the system, press the "Diversion Rating Curve" button on the left hand side of the Lateral Structure editor, shown below.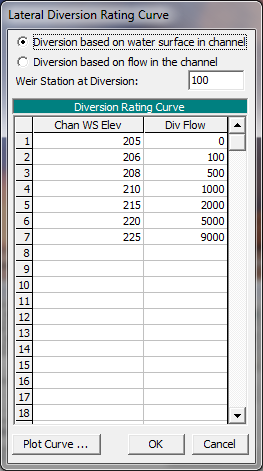
Lateral Rating Curve Editor
The user first selects the type of rating to be used: channel water surface versus diverted flow or channel flow versus diverted flow. Next, the distance between the location of the diversion and the cross section just upstream of the structure must be entered in order to locate the diversion. Finally, the user enters the actual rating curve. The curve is entered as the amount of flow leaving, verses the elevation of the water in the main river or flow in the main river. NOTE: This rating curve does not take into account any influence of the tailwater elevation in order to reduce the flow.
Outlet Time Series
This option allows the user to specify a name for an Outlet time series. Then a Flow Hydrograph can be specified for the Lateral Structure in the Unsteady Flow Data editor. The flow time series will be labeled in the output based on the user entered name for the Outlet Time series.
Linear Routing Option
The final option for connecting a Storage Area to another Storage Area is to model the connection as a Linear Routing Method. This option uses a coefficient times the difference in available storage between the two storage areas, divided by the time step. 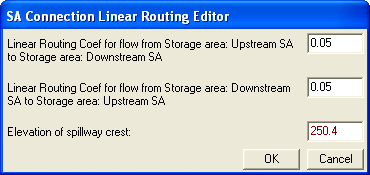
Simple Spillway Data Editor
As shown in the Linear Routing editor, the user must enter a linear routing coefficient for both the positive and negative flow directions. Additionally, the minimum elevation of the spillway crest must be entered. If both water surfaces go below the spillway crest, no flow is passed between the storage areas. The Linear routing option can only be used to connect two storage areas. It cannot be used when one of the connections is a 2D Flow Area.