The relationship between flow and load can change systematically over time.  If you cannot assume that the relationship between flow and load is "stationary" (constant over time), it may not be appropriate to use all the data for an analysis or model.  For, example, when calibrating a model in a system with a non-stationary sediment data, it is appropriate to use the historic rating curve that reflects the data over the calibration period.  Alternately, when forecasting, it is appropriate to use a rating curve based on the most recent relationship.  Scientists and modelers should always - at a minimum - evaluate their data stationarity.  But if sediment data are non-stationary, they must partition their data to develop a rating curve appropriate for the time period under consideration.

The rating curve calculator includes stationarity tools that allows users to visualize stationarity by plotting the data before and after a selected year in different colors, and reports separate rating curves for those before and after data.

The Stationarity Slide Bar

By default the rating curve data uses all the data available.  For example, in the first image below, the tool fits a single, bias-corrected, power function through a data set.  The Stationarity tool partitions the data by date to visualize and quantify temporal trends.  The Stationary tool provides a scroll bar that spans the time between the earliest and latest measurement.  Users can then move the bar to evaluate stationarity across different dates.  The date before and after the selected year will plot in different colors to help visualize non-stationarity.  For example, the second figure below uses the same data as the first, but plots the measurements prior to 1953 in yellow and those after in purple.  The older data trend higher, but were also collected over a larger range of flows.  This is typical of changes observed after dam constrcution.

Warning - Stationarity Analysis Requires Temporal Data

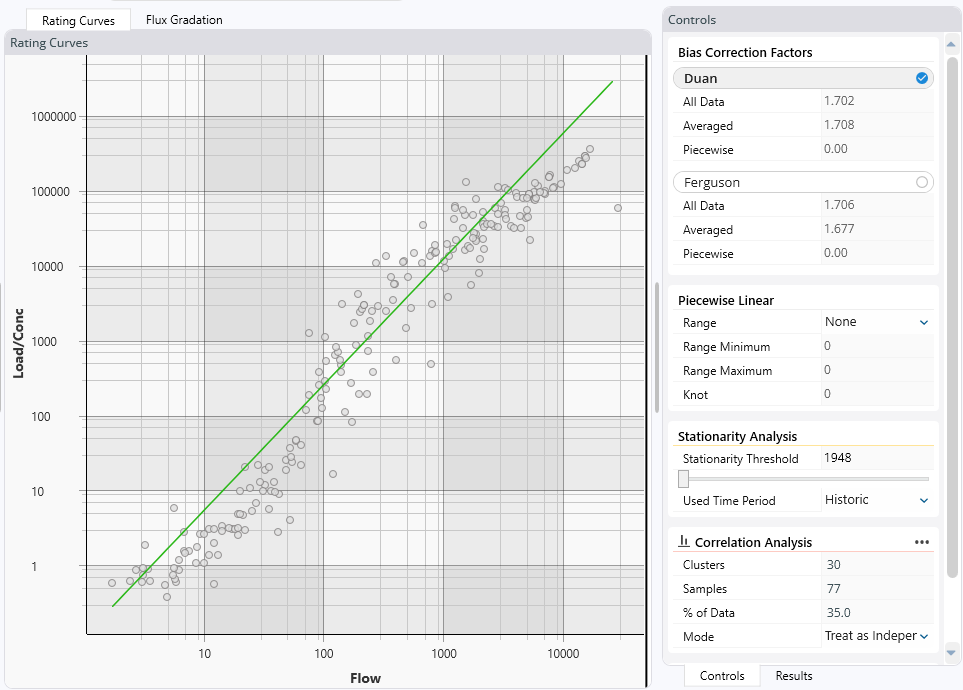
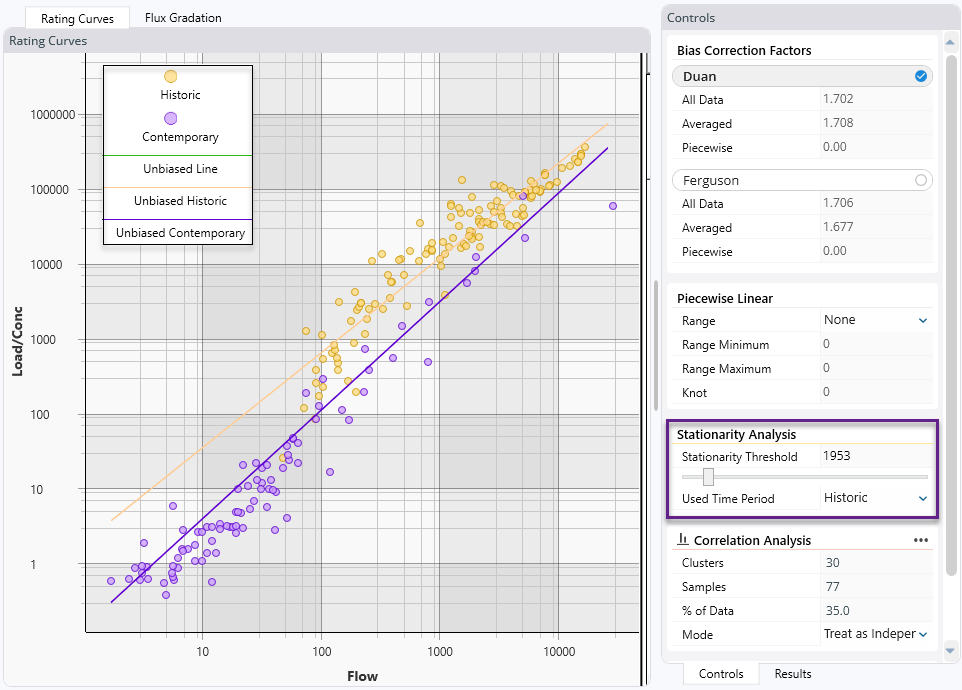
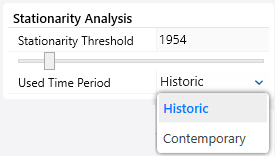
The rating curve calculator can fit a bias corrected rating curve (or a piecewise linear model) to sediment data without any temporal data.  Users can input simple, paired, flow-load/concertation information  without dates or times and use these features.  But stationarity is a temporal analysis.  The stationary options will only be available if the data include dates and times.


Wish List - Additional Stationarity Methods

We would like to add several additional stationarity analysis methods, including color coding data by date (e.g. monochrome plotting with the lightest tone earliest and the darkest latest) or color coding the data by temporal bins (e.g. decades).  We would also like to compute load for a given flow(s) with the before and after rating curves for the entire date range to explore how the rating curves evolve over time.