Download PDF
Download page Geometric Preprocessor.
Geometric Preprocessor
The Geometric Preprocessor is used to process the geometric data into a series of hydraulic properties tables, rating curves, and family of rating curves. This is done in order to speed up the unsteady flow calculations. Instead of calculating hydraulic variables for each cross-section, during each iteration, the program interpolates the hydraulic variables from the tables. The preprocessor must be executed at least once, but then only needs to be re-executed if something in the geometric data has changed.
Cross Section Property Tables
Cross sections are processed into tables of elevation versus hydraulic properties of areas, conveyance, and storage. The preprocessor creates hydraulic property tables for the main channel, and the floodplain. The floodplain hydraulic property tables are a combination of the left overbank and right overbank properties summed together in a single set of curves called the "Floodplain". The Unsteady flow engine uses a simple arithmetic average of the left and right overbank reach lengths in order to compute a floodplain reach length (i.e. the floodplain reach length is computed as the left overbank reach length plus the right overbank reach length, then divide by 2). The floodplain reach length is used to calculate storage volume, friction losses, etc… and all other hydraulic properties used in the continuity and momentum equation for the floodplain area. This is different than what is done in the steady flow computational program, in which it computes left overbank and right overbank hydraulic properties separately.
Each hydraulic property table contains a minimum of 21 points (a zero point at the invert and 20 computed values), and can have up to a maximum of 100 points. The user is required to set an interval to be used for spacing the points in the cross section tables. The interval can be the same for all cross sections or it can vary from cross section to cross section. This interval is very important, in that it will define the limits of the table that is built for each cross section. On one hand, the interval must be large enough to encompass the full range of stages that may be incurred during the unsteady flow simulations. On the other hand, if the interval is to large, the tables will not have enough detail to accurately depict changes in area, conveyance, and storage with respect to elevation.
The interval for the cross section tables is defined as part of the geometric data. To set this interval, the user selects the HTab Parameters (Hydraulic Table Parameters) button from the Geometric Data editor. When this option is selected, a window will appear as shown in the figure below.

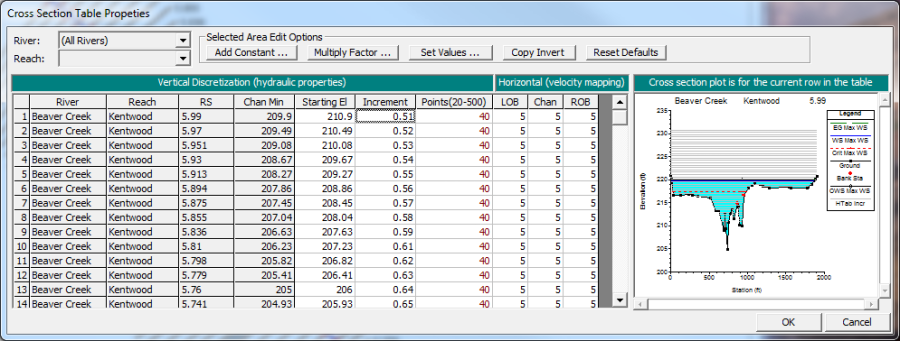
As shown in Figure 7-15, the table contains three columns in which the user can enter a Starting Elevation, Increment, and Number of Points. The first time the user opens this editor all of the columns are automatically filled. The starting elevation columns are automatically filled to an elevation one foot higher than the invert. However, the user can change the starting elevation values to whatever they want. The second and third columns are used for the table increment and the number of points. These two variables will describe the extent to which the table encompasses the cross section data. A default value will be set for the increment and the number of points. Normally the increment will be set to one foot, and the number of points will be set to a value that will allow the table to extend to the top of the cross section. If this combination would end up with less than 20 points, then the number of points is set to 20 and the increment is reduced to get the table to the top of the cross section. The user can set these values individually for each cross section, or they can highlight a series of cross sections and use the Set Values button to enter the value for all of the highlighted sections. Other options are available to multiply highlighted fields by a factor or add a constant to all of them. Additionally, cut, copy, and paste are available for manipulating the data (using standard windows function keys). Warning: The hydraulic tables for cross sections must be high enough to capture all possible water surface elevations. It is up to the user to ensure that the combination of the increment and number of points produces a table that will extend to a high enough elevation. If the computed water surface goes above the table, properties are extrapolated by extending the last to points linearly. This extrapolation can often cause the model to go unstable.
Three additional fields are also in the table, under the heading of "Horizontal Velocity Mapping". These fields are used for computing more detailed velocity estimates within a cross section, than the default of a single average value in the left overbank, main channel, and the right overbank. These fields can be used to enter a number of slices to further discretize the computation of average velocities within a cross section. These vertically and horizontally averaged velocities are used for mapping velocity within the 1D cross sectional flow fields. Once the Geometric preprocessor is run, the user can view the cross section hydraulic property tables for the channel and floodplain from the HEC-RAS interface. During steady flow profile computations, the program will calculate the flow, area, wetted perimeter, percentage of conveyance, and average velocity for each of the user defined slices. For details on how the flow distribution output is actually calculated, see Chapter 4 of the HEC-RAS Hydraulic Reference Manual. For information on viewing the flow distribution output, see Chapter 9 of the User's Manual (this manual).
Hydraulic Structure Property Tables
Hydraulic structures, such as bridges and culverts, are converted into families of rating curves that describe the structure as a function of tailwater, flow, and headwater. The user can set several parameters that can be used in defining the curves. To set the parameters for the family of rating curves, the user can select the "HTab Parameters" button from the Bridge and Culvert editor or from the Storage Area Connection editor. When this button is pressed, the window in Figure 7-16 will appear: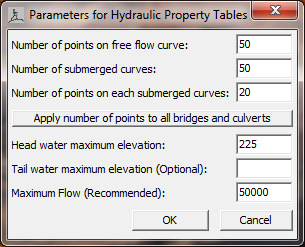
Figure 7 16. Hydraulic Properties Table for Bridges/Culverts
As shown in Figure 7-16, the user can set the number of points to be computed on the free-flow rating curve (maximum of 100 points); the number of submerged curves to be computed (maximum of 60); and the number of points on the submerged curves (maximum of 50). The default values for these parameters are 50, 50, and 20 respectively. Additionally, the user can refine the curves by setting limits on the extent of the curves. This can be accomplished by entering the head water maximum elevation (required), tail water maximum elevation (optional), and the maximum possible flow (recommended). In general, the curves will come out better if the user enters a headwater maximum elevation and a maximum flow rate.
Viewing the Preprocessor Hydraulic Properties Tables
![]() Once Hydraulic Table parameters have been entered for the cross sections and the structures, and the preprocessor has been run, the user can view the computed curves by either selecting Hydraulic Property Plots from the View menu of the main HEC-RAS window, or by pressing the HT button on the main HEC-RAS window. When this option is selected the following window will appear.
Once Hydraulic Table parameters have been entered for the cross sections and the structures, and the preprocessor has been run, the user can view the computed curves by either selecting Hydraulic Property Plots from the View menu of the main HEC-RAS window, or by pressing the HT button on the main HEC-RAS window. When this option is selected the following window will appear.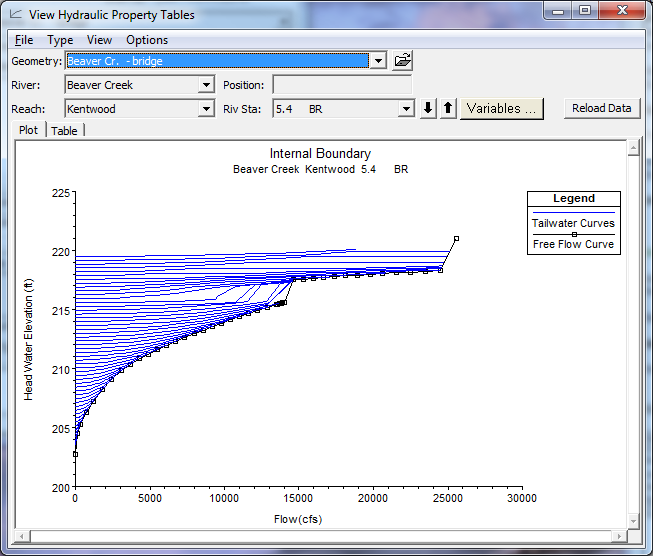
Figure 7 17. Plot of Hydraulic Property Tables Computed by the Preprocessor.
As shown in Figure 7-17, the user can plot properties for cross sections, internal boundaries (Bridges and culverts), or storage area connections by selecting the type of plot from the Type menu option. Additionally the information can be viewed in tabular form by selecting the Table tab on the plot. The user should view all of the computed curves for their model closely to ensure that they are hydraulically appropriate.
Structures that are gated, such as gated spillways, are not converted into curves because it would require a new family of curves for each possible gate setting. The hydraulics through gated structures is calculated on the fly during the unsteady flow calculations. No hydraulic table parameters are required for gated structures. Additionally, if a storage area connection is set up as a weir only, it can either be preprocessed into curves, or the user has the option of having the program compute the hydraulics on the fly for each time step.