Download PDF
Download page Pipe Network - Results.
Pipe Network - Results
Spatial Results
Similar to 1D and 2D model results, pipe network results are spatially plotted in the RAS Mapper. When a modeling simulation containing a pipe network completes, four new default map layers are added to the map window : Pipe HGL, Pipe Depth, Percent Full, Pipe Velocity. 
Since the size of stormwater pipes is often very small compared to the surface geometry or model domain, the results can be hard to see or become obscured by other model results and geometry elements. To improve the visualization, default render options are provided to laterally scale the pipe results so they can easily seen when zoomed out. Another default option allows pipe results to display on top of surface model results for easier visualization. These options can be accessed through the Tools > Options > Render Mode as shown below. e
e
Interpolated pipe results time series can be queried by right-clicking anywhere on the pipe results, and selecting Plot Time Series as shown below. Note that the desired result layer must be checked in the tree view to access the time series.

In addition to the interpolated spatial results, compute engine results for cells and faces can be accessed by selecting the Pipe Network layer in the tree view, and right-clicking the cell or face in the pipe mesh, as shown below.
Profile Plots
Pipe network profile plots allow the user to visualize the conduit and surface geometry, and plot many different results variables for a simulation in profile view. Within the profile plot users can visualize the pipe network hydraulic grade, energy grade, critical depth, and velocity and flow along the profile of the pipe. In addition, the surface terrain and surface stages are plotted along the conduits.

The left pane of the profile plot allows the user to select or deselect conduits to plot. Holding Ctrl and clicking will add to, or take away from the existing selection. Filters ![]() at the top of each column can be used to sort of filter the table by attributes to make finding the desired conduits easier.
at the top of each column can be used to sort of filter the table by attributes to make finding the desired conduits easier.
The profile map can be animated via the animation pane at the top, or can be animated using the controls from RAS Mapper. The benefit of using the controls in RAS Mapper is that all results (profile plots, hydrograph plots, and spatial results will be synched.
Resize Flow or Velocity Y axis
When viewing simulation results in the profile plot, and the velocity or flow profiles exceed the range of the axis, right click in the velocity or Flow plot and select Full Plot (Hotkey: Esc) to resize the y axis to fit the results.
When hovering over the profile plot a bobber is shown at that location in RAS Mapper to indicate where the conduit is spatially in the model domain with magenta dots along the conduit.
Profile Plot Save Lists
List of conduits can be saved such that the user can quickly see different groups of conduits from the profile plot using Saved Lists. To create a Saved List, select the desired conduits in the Profile plot, then select Edit Saved Lists... In the window that appears, hitting the + button will create a Saved List with the selected conduits and allow you to name it.
Once the Saved List is created, the conduits in the list can plotted by selecting the list in the dropdown as shown below.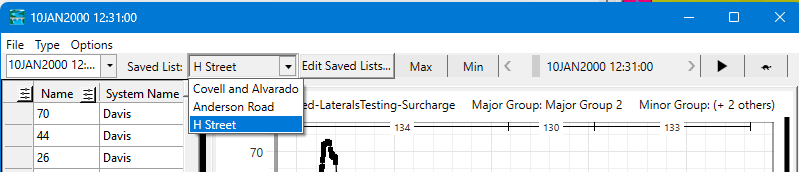
Accessing Profile Plots and Selecting Conduits
There are a few options for accessing results profile plots for the pipe network simulation, depending on how you want to select which conduits to view in the plot.
The first option is to launch the profile plot and subsequently select the individual conduit to plot from the table. This option is good for smaller systems where accessing the desired conduits from the table isn't a burden. This option can still be used for larger datasets, as long as the Major and Minor Groups are setup on conduits, in which case you can access them easier by filtering or sorting the table in the profile plot. A demonstration of accessing the results profile plot this way is shown below.

The other option for accessing the profile plot is to select the desired conduits from RAS Mapper before launching the plot. To do this, select Conduits layer in the tree view, then begin selecting conduits using the select tool. Then Right-Click → Plot Results Profile.
There are also options to select all Upstream Conduits, select all Downstream Conduits, and select all the conduits that belong to Major and Minor Groups under the Show Conduits option when a the conduit is right-clicked. This option for accessing the result profile plot is shown below.
Similarly, the conduits along a path can be selected by first selecting two conduits, as shown below, then right-click > Show Conduits and selecting one of the two 'Path' options. Select Shortest Path will select the shortest path regardless of the conduit directions. Select Shortest Direct Path will select all the conduits in between following the drawn directions. 
Major and Minor Groups can be set for easier access to conduits by editing them in the attribute table wen in edit mode, or by spatially selecting the conduits and accessing the Assign Selection... menu from a right-click, as shown in the figure below.
Note
After creating Major and Minor Groups in RAS Mapper, the model will have to be rerun before they can be used for output.
Stage and Flow Hydrographs
Stage flow hydrographs are available for both Pipe Nodes and Conduits, and they can be accessed from the main HEC-RAS Interface or RAS Mapper.

When stage and flow hydrograph plot opens, the correct Type will have to be selected from the Type menu as shown below.

The stage and flow hydrograph plots will by default inflows and outflow to nodes from conduits, inflows from Top + Side Inlets, stages, and observed data (if defined). Additional variables, such as stages for the connected surface nodes, can be added to the plot from the Options > Variables menu.
Cross Section Views and Property Tables
Once a simulation has been run, cross-section views of conduits along the the computed property tables can be accessed through the Hydraulic Property Tables button from the main RAS interface. The water surface and location in the corresponding property tables can be view for the US face of the conduit DS face of the conduit or both.

