Detailed output tables show hydraulic information at a single location, for a single profile. To display a detailed output table on the screen, select Detailed Output Tables from the View menu of the main HEC-RAS window. An example detailed output table is shown in Figure 8 21.

Figure 8 21 Example Cross Section Detailed Output Table
By default, this table comes up displaying detailed output for cross sections. Any cross section can be displayed in the table by selecting the appropriate river, reach and river station from the list boxes at the top of the table. Also, any of the computed profiles can be displayed by selecting the desired profile from the profile list box. Additionally, different plans can be viewed by selecting a plan from the plan list box.
Users can also view detailed hydraulic information for other types of nodes. Other table types are selected from the Type menu on the detailed output table window. The following types are available in addition to the normal cross section table (which is the default):
Culvert. The culvert table type brings up detailed culvert information. This table can be selected for normal culverts, or for culverts that are part of a multiple opening river crossing. An example culvert specific table is shown in Figure 8-22.
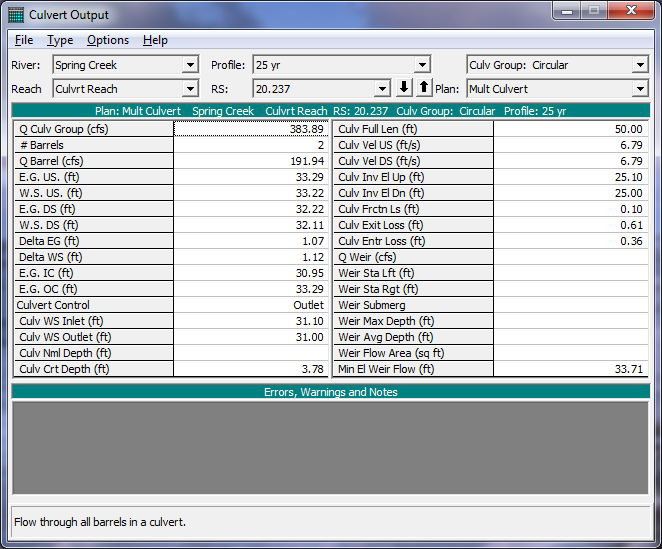
Figure 8 22 Example Culvert Type of Cross Section Table
Bridge. The bridge table type brings up detailed output for the cross sections inside the bridge as well as just upstream of the bridge. The bridge table type can be selected for normal bridge crossings, or for bridges that are part of a multiple opening river crossing. An example of the bridge specific cross section table is shown in Figure 8-23.
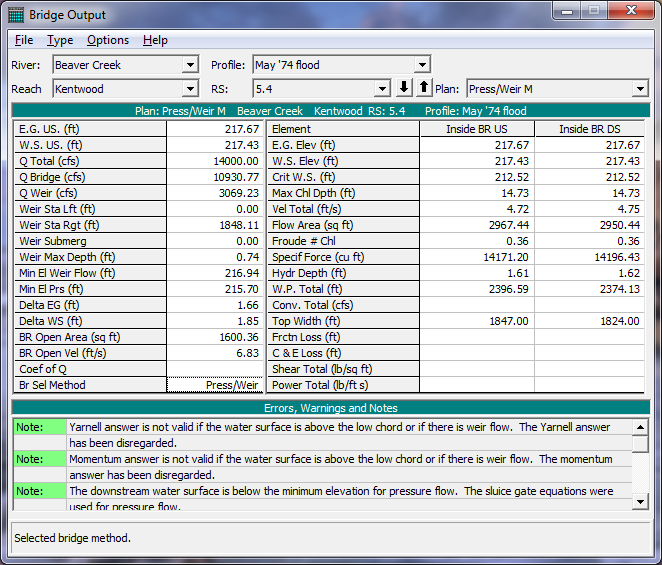
Figure 8 23 Example Bridge Type of Cross Section Table
Multiple Opening. The multiple opening type of table is a combination of the cross section table and the bridge and culvert tables. That is, if the user has defined multiple opening (bridges, culverts, and conveyance areas), then this table can be used to view the hydraulic results for each specific opening.
Inline Structure. The Inline Structure type of table can be used to view detailed output for any inline weirs and/or gated spillways that have been entered by the user.
Lateral Structure. The Lateral Structure type of table can be used for viewing detailed output from a lateral weir, gated spillway, culvert, and rating curves.
Storage Area. This table provides output about an individual storage area. Information includes water surface elevation, total inflow, total outflow, and net inflow.
Storage Area Connection. This table provides detailed information about storage area connections. Storage area connections can consist of weirs, gated spillways, and culverts.
Pump Stations. This table provides detailed information about pump stations. Pump station output includes to and from water surface elevations, total flow, flow through each pump group, flow through each pump, head difference, and efficiency.
Flow Distribution In Cross Sections. The Flow Distribution table type can be used to view the computed flow distribution output at any cross section where this type of output was requested. An example of the flow distribution table output is shown in Figure 8-24.

Figure 8 24 Example of the Flow Distribution Type of Table
At the bottom of each of the detailed output tables are two text boxes for displaying messages. The bottom text box is used to display the definition of the variables listed in the table. When the user presses the left mouse button over any data field, the description for that field is displayed in the bottom text box. The other text box is used to display any Errors, Warnings, and Notes that may have occurred during the computations for the displayed cross section.