Download PDF
Download page Google Earth Export.
Google Earth Export
HEC-RAS inundation maps are able to tell a complex story of the flooding potential in our river floodplains. While users can display background imagery using web services in HEC-RAS, it is often not the best way to avail to the results to non-RAS users. Google Earth, however, is a powerful visualization tool that can be used to display inundation boundary maps. HEC-RAS has two different ways to create inundation maps using the KML format specific to Google Earth.
Provided you have an inundation boundary polygon developed in HEC-RAS, you can export it either to a KML file or to a 3D KML by simply right-clicking on the inundation boundary polygon and selecting the Export Layer menu option.
KML Export
To create a KML, perform the following steps listed below.
- Create and Inundation Boundary layer in RAS Mapper.
- Right-click on the Inundation Boundary layer and choose the Export Layer | Save Features to KML menu option.
- Provide a filename and press OK.
- The KML can then be added to a Google Earth instance (or likely you can double-click on the KML and it will launch and load Google Earth).
Experience has shown, that KML files with more that 10,000 points do not render well in Google Earth. Therefore, you may consider filtering the inundation boundary polygon, prior to KML export.
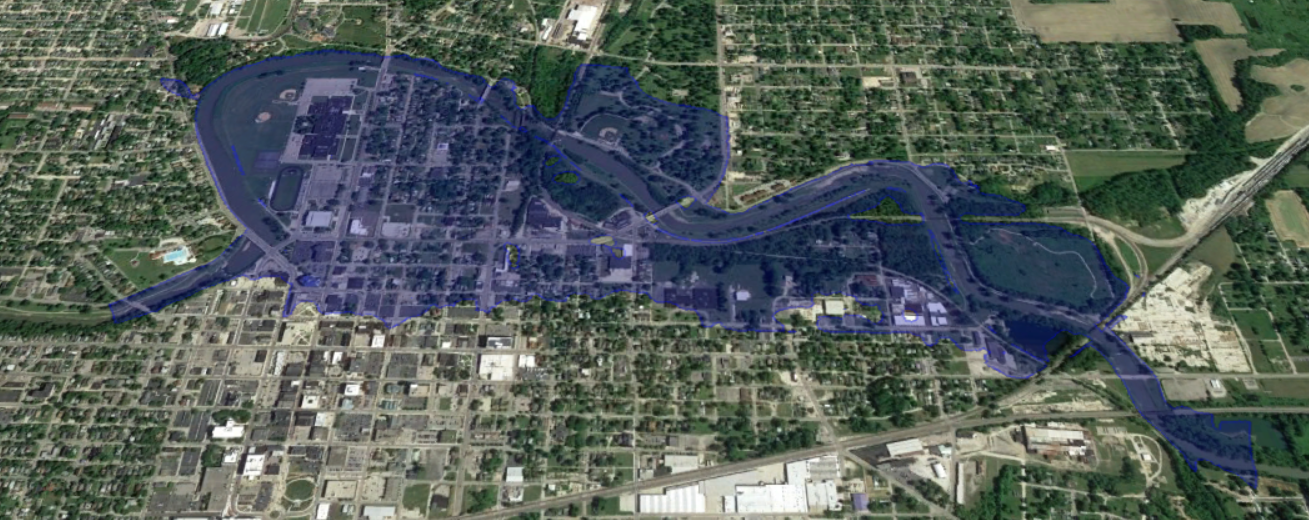
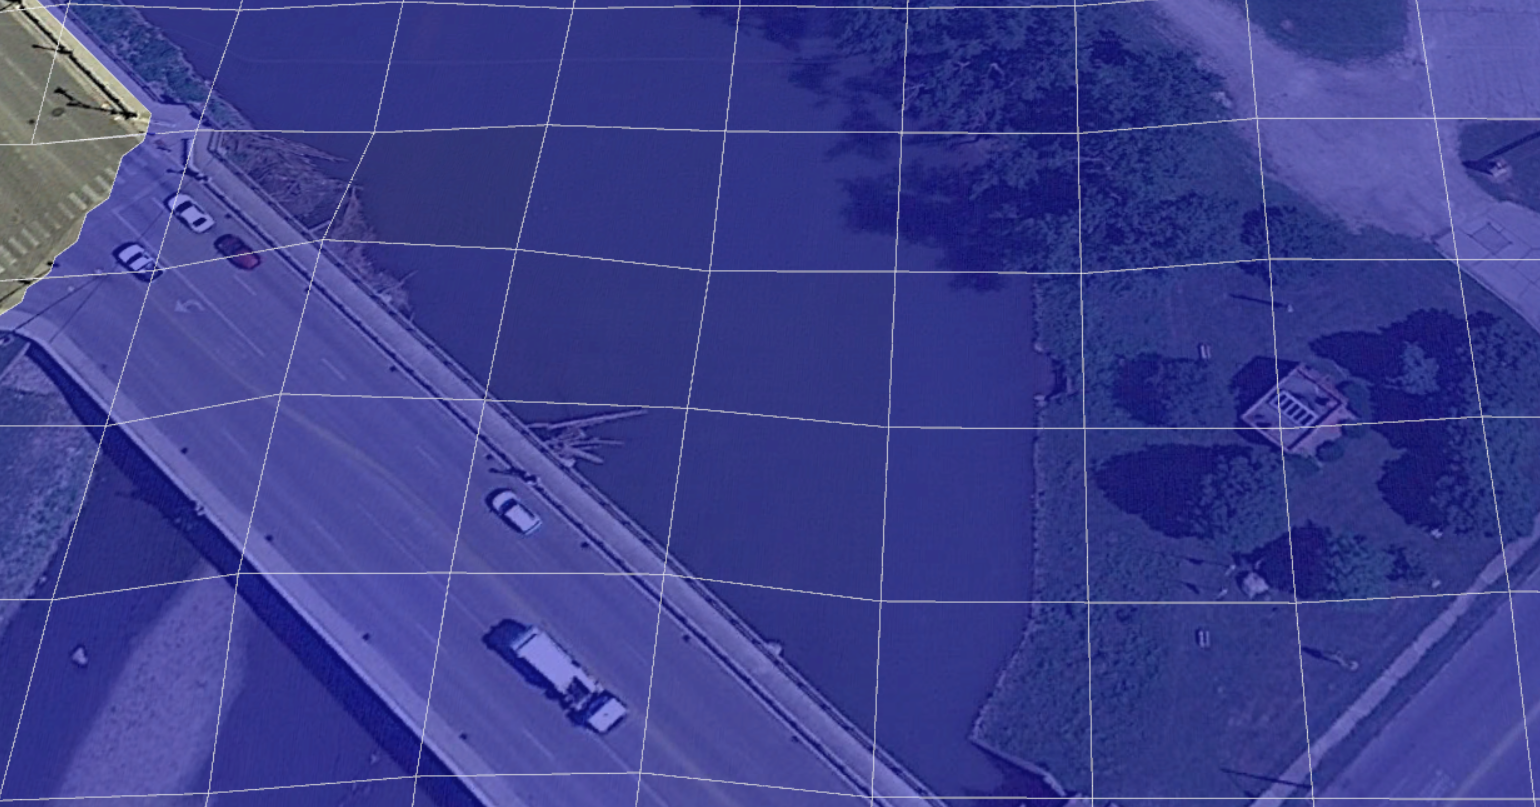
An example inundation KML in Google Earth is shown below.
3D KML Export
To create a 3D KML, perform the following steps listed below.
- Create and Inundation Boundary layer in RAS Mapper.
- Set the symbology to the color and transparency (blue, 50% are good values).
- Right-click on the Inundation Boundary layer and choose the Export Layer | Save Inundation to 3D KML menu option.
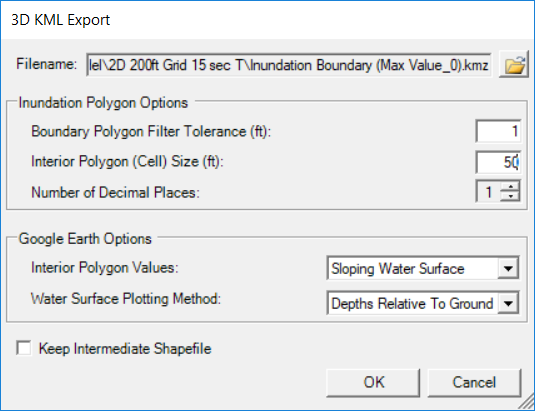
- The 3D KML export dialog will be shown.
- The default name and location of the KMZ file (zipped up KML) will be based on the Plan that produced the inundation boundary. You can change the name and file location using the Browse button.
- The default values for the output options are good suggestions. They are discussed in detail below.
- Press OK to generate a KMZ file to use in Google Earth.
- As the file is generated, a status message will inform you of the progress. The number of polygons that are processed for the entire file extent is shown and the maximum count.
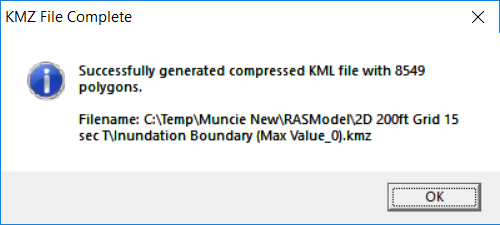
- When finished, a message box will report the filename location and number of polygons in the KML file.
- The KMZ can then be added to a Google Earth instance (or likely you can double-click on the KMZ and it will launch and load Google Earth).
The final file is a KMZ file, which is a zipped up KML file. The smaller file size will improve sharing the floodplain inundation.
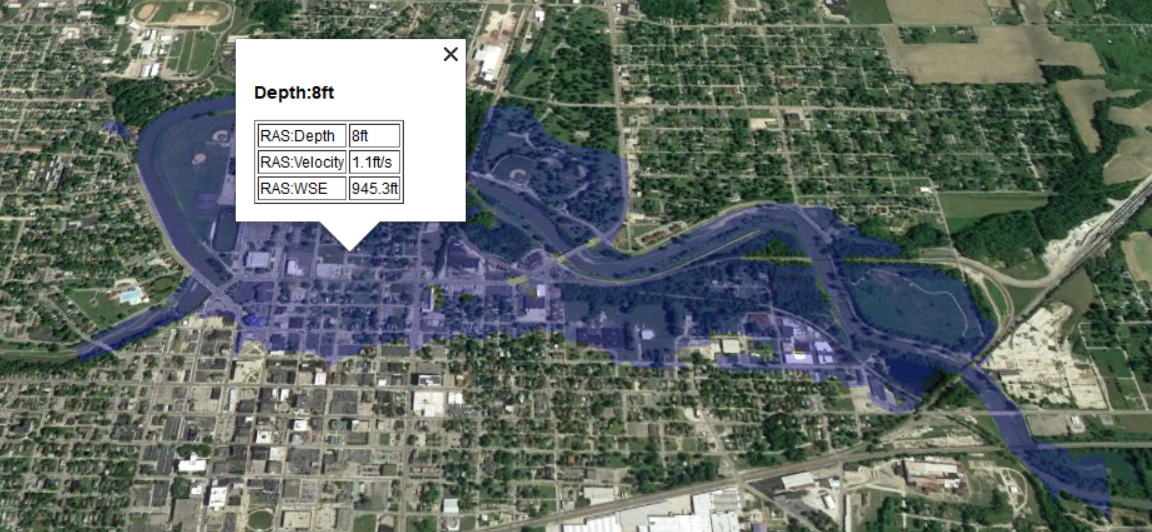
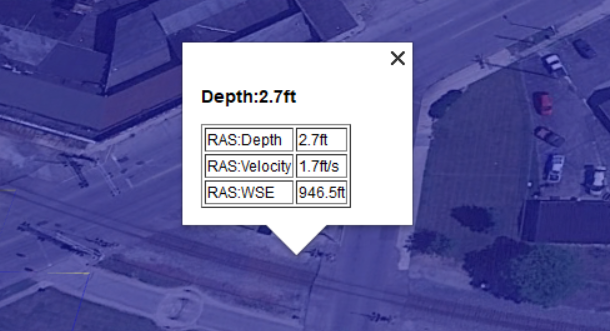
The 3D KML file may initially look a lot like the 2D KML file discussed above, as Google Earth will zoom to the extents of the data. Interacting with the map is when the "3D" aspect starts to get interesting. The 3D KML file allows you to interact with it by clicking on a particular location. The depth, water surface elevation, and velocity for that area will be reported.
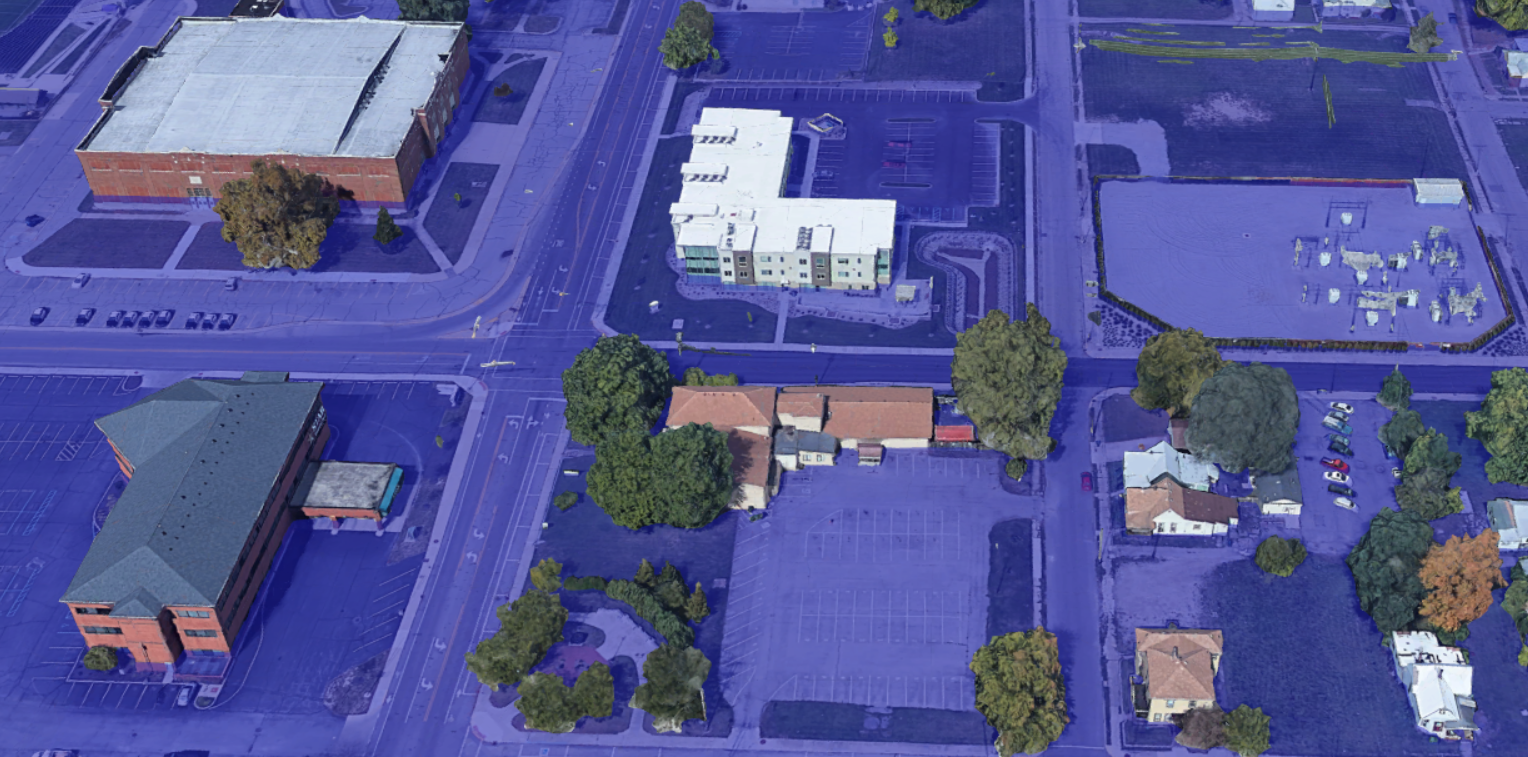
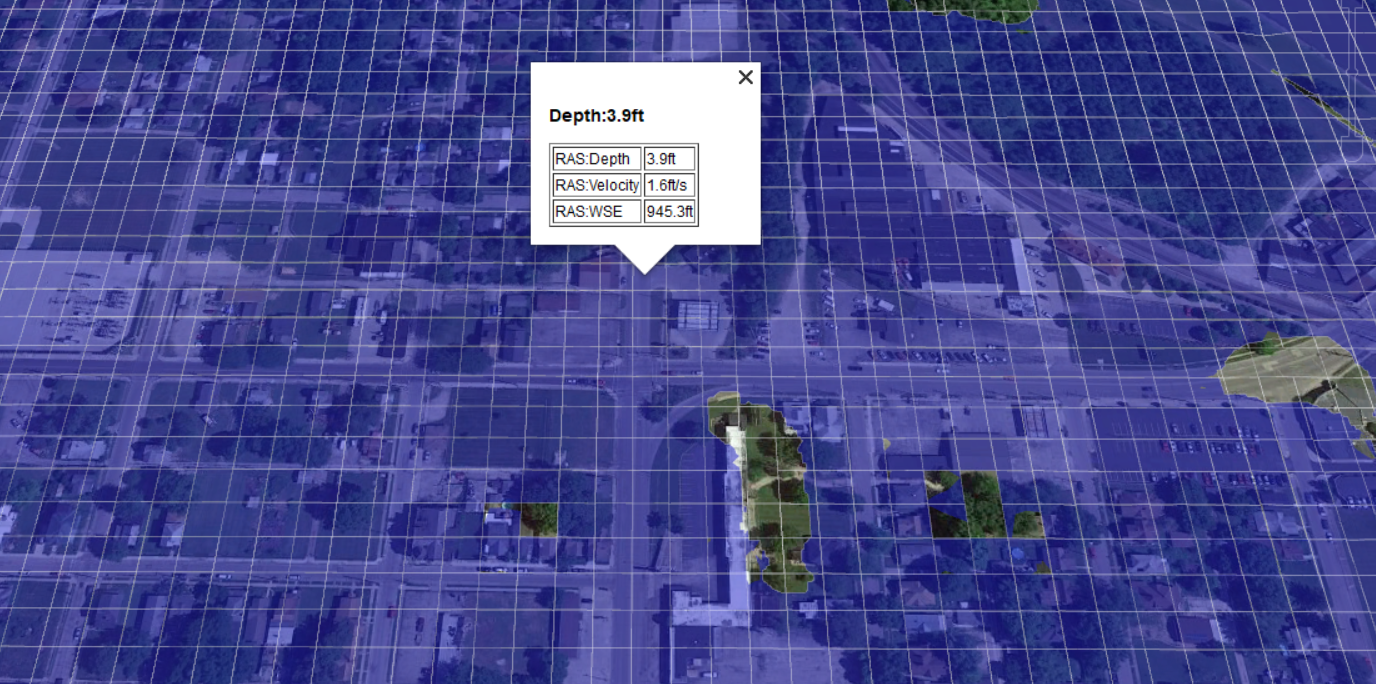
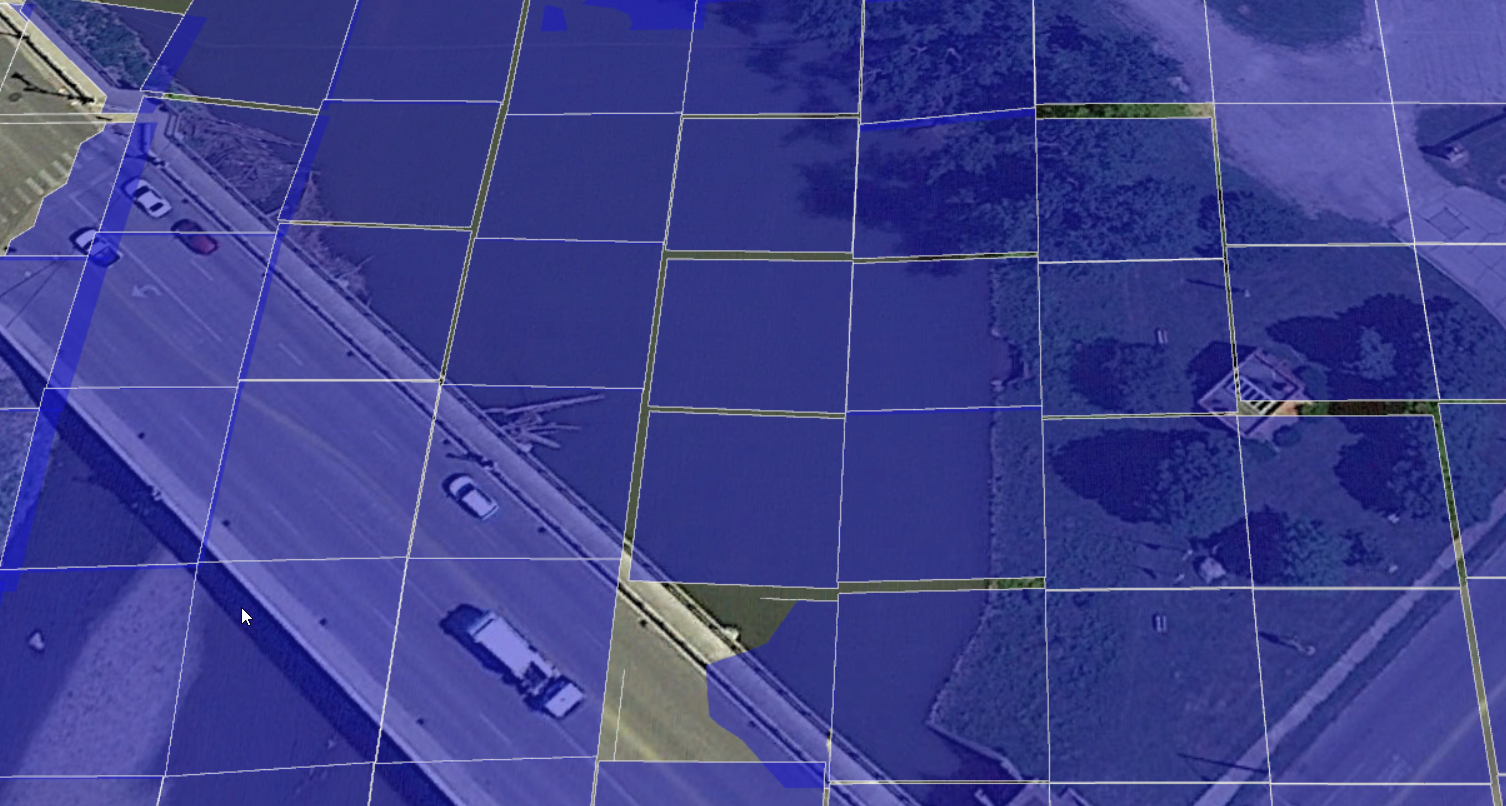
At this point, let's make it clear that the 3D KML file you are visualizing is a vector representation of an HEC-RAS results grid. The reported results in the 3D KML are values based on interpolated HEC-RAS results for the center of the 3D KML polygon. This is more obvious if we turn on the polygon boundaries, as shown in the figure below. While the point values are exacting, they do lend insight into the potential hazards for a particular area for the event being considered.
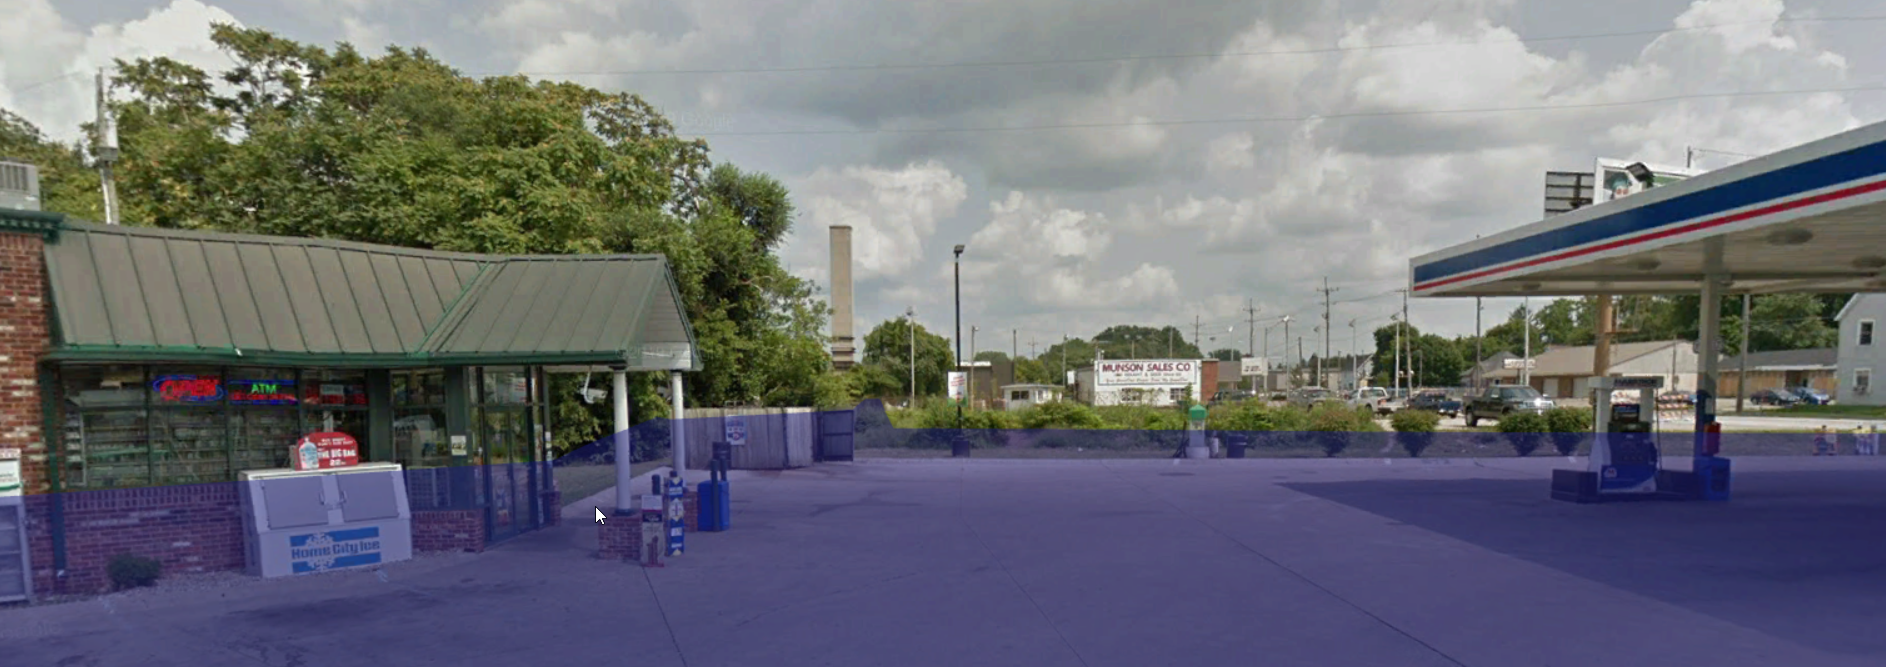
Providing interaction with the map is very useful, but there are better ways to visualize results in Google Earth. Choose a location and enter "Street View".
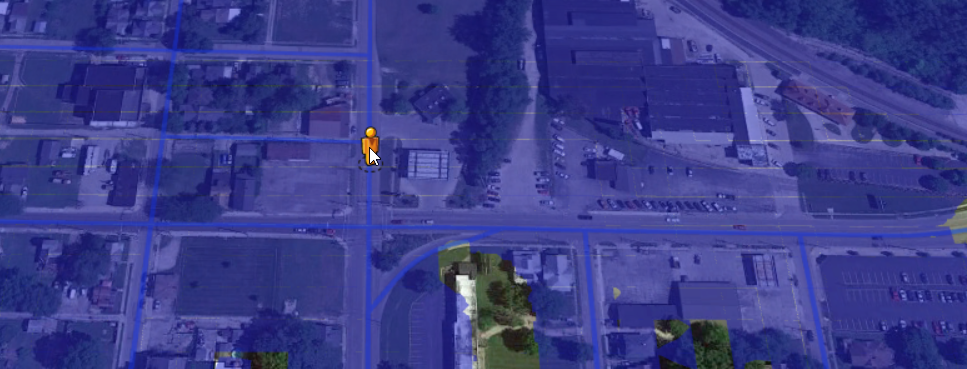
You can now visualize the water level in perspective to cars, buildings, sign posts and other features to inform you how the flood hazard.
3D KML Export Options
There are several options available when exporting the inundation boundary 3D KML. These option control what the KML will look like in Google Earth. Experimentation with your data and study area may be required to discover the best option for you.
Boundary Polygon Filter Tolerance
The polygon filter tolerance is used evaluate the floodplain boundary and remove "redundant" points. If the filter tolerance is set to 0, no filtering will occur. For all other values, three consecutive points along the boundary are evaluated by connecting the first and third point by a straight line. If the second point of the three is within the distance tolerance of the line, the point is removed. Removing the number of points in the inundation boundary can reduce file size and improve rendering speeds in Google Earth, but sacrifices accuracy. The default value is 1ft.
Interior Polygon (Cell) Size
The KML created is a vector representation of a raster (gridded) dataset. HEC-RAS attempts to come up with a cell size that will result in a KML that has 10,000 polygons - which tend to render well in Google Earth. However, you may want more detail (smaller polygon size) or less detail (larger polygon size).
Number of Decimal Places
This rounds the water surface, depth, and velocity results written to the KML. Queried values will be reported to the number of decimal places specified. The default value is 1 decimal place.
Interior Polygon Values
There are two methods available in HEC-RAS for reporting the water surface elevations and depth values written to the KML file. The Sloping Water Surface method will interpolate the water surface elevations and write out the water surface elevations for each corner of of the interior polygons and a value at the center of the polygon (that can be queried). This will allow the water surface to looked sloped in Google Earth. The Horizontal Water Surface method applies the water surface at the center of the polygon to each side. This can result in "stair stepped" inundation in steeper terrain. The Sloping Water Surface method is default.
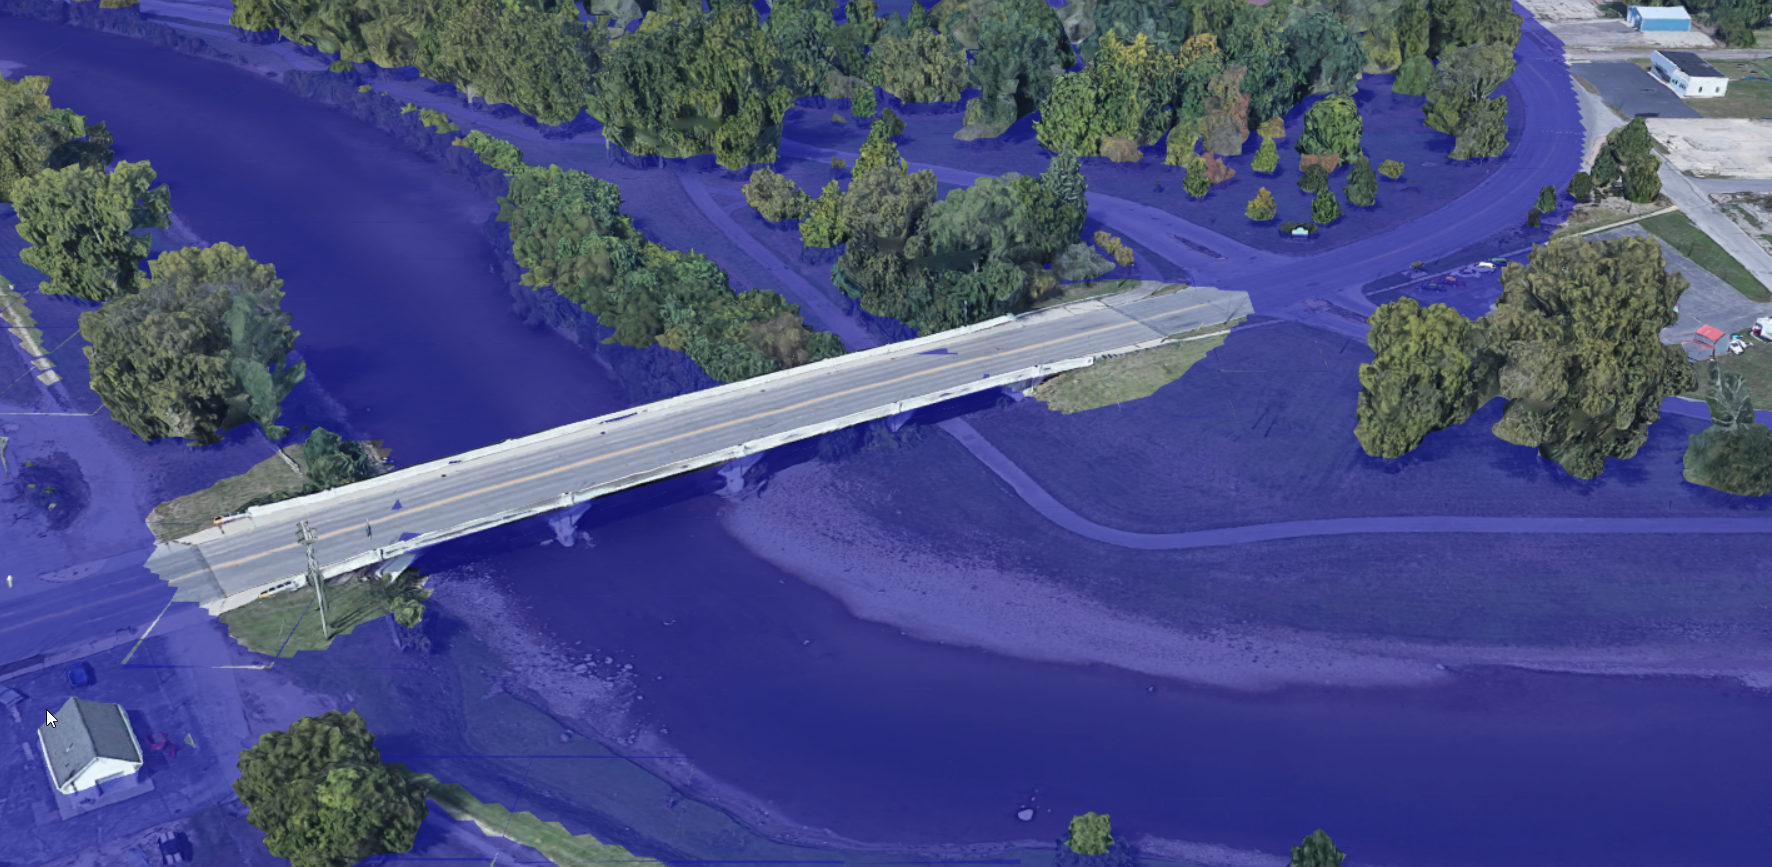
A example plot using Sloping Water Surface shows a continuous water surface (the bulging in the upper left corner is due to using the Depths Relative to Ground option and that the bridge deck is in the Google Earth ground surface elevations).
An example plot using Horizontal Water Surface example where the "flat" water surface results in an elevation gap at the boundary of each polygon.
Water Surface Plotting Method
Google Earth thankfully provides two different ways to visualize elevation data: absolute values and values relative to the ground. Which option is best for you is dependent on how good the data are in your study area and what detail you are interested in visualizing. The Depths Relative to Ground option will plot the output depth on top of whatever ground elevations Google Earth is reporting. This method works best when the Google Earth terrain data is "poor" relative to the terrain model used to create the HEC-RAS model. This method also tends to work better in steeper terrain. When you query the inundation map, depth with be the primary identifier. The Computed WSE option will plot the computed water surface elevation without considering the Google Earth terrain values. Limitations of the Computed WSE option become more clear when looking at the floodplain boundary - often the Compute WSE boundary will be limited base on it's intersection with the ground. The Depths Relative to Ground option will always show the correct boundary, although the visualization of the flood depths interior to the boundary may not be perfect. The Depths Relative to Ground option is default.
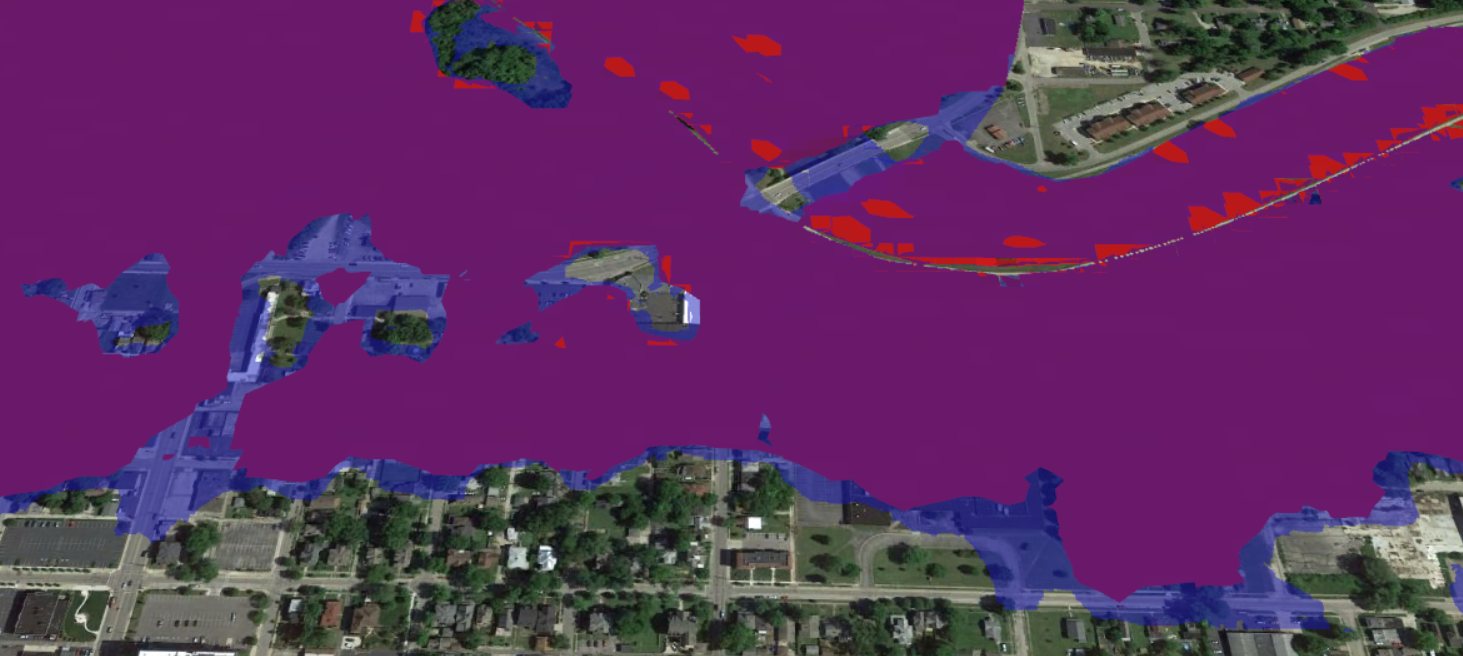
An example of plotting differences in Google Earth using the Depths Relative to Ground (blue) option overlayed with Computed WSE (red) option. The Computed WSE option performs poorly at shallow depths because it is attempting to intersect the computed HEC-RAS water surface (which is based on high resolution terrain) with the Google Earth ground surface elevations (which will not be consistent with the terrain used in the RAS model.
Google Earth Visualization
Street View is a great way to visualize flood depths at buildings, etc.; however, you can also turn on Google Earth 3D Buildings to get an idea overall on what is flooded and by how much. This option is down in the Layers list and labeled "3D Buildings". While this can produce a dramatic picture, trees tend to get in the way of the rendering.