Download PDF
Download page Tile Map Server.
Tile Map Server
RAS Mapper provides the capability to export HEC-RAS Results for visualization using web mapping services. This option provides the flexibility to publish map results to a web server (or locally) to use web-based mapping as the background for the HEC-RAS results.
Exporting RAS Tiles
To write information into the map tile system, select a dynamic raster result, right-click and choose the Export RAS Tiles for Web Mapping menu item. The RAS Tile Cache Export Options dialog will be populated with a default Layer Name, Cache Level, and Profile (Time, Max, or Min based on what is active in RAS Mapper). Map tiles will be stored in PNG format in a database file in the RAS Model directory using symbology defined for the Layer in RAS Mapper will be used for storing the exported data. By default, the data will be written to a database file (.db extension) that has a filename based on the HEC-RAS Plan Short ID.
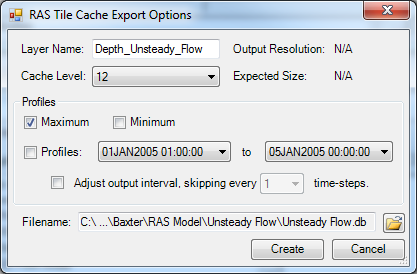
The Cache Level used will greatly affect the time it takes to write out the map tiles because the Cache Level corresponds to the effective cell size resolution of the raster that is stored. The process of creating each PNG for the tile cache requires RAS Mapper to re-compute the output variable layer (depth, for instance) for each cache level. The PNG must then be re-projected to the web Mercator projection supported by web mapping services and written to the ‘db’ file. This can be a time consuming process - larger Cache Levels will result in smaller “cell” sizes and larger file sizes.
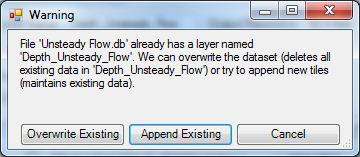
The Cache Level also indicates how far you can zoom into the map. If you attempt to zoom in beyond the pyramid level of the tile cache, the data will be interpolated. The default Cache Level is 12 and is recommended for a first cut look at the data at a low resolution that will not sacrifice speed. If you write out data using an initial Cache Level and then wish to add additional levels, RAS will append the data, assuming the output Layer Name (and time step) is consistent – the dialog shown below will appear allowing the user to overwrite or append to existing data.
The other option affecting what is written to the map tiles is the Profile selected. The options of Maximum, Minimum, or Profiles are available. If the Profiles option is selected, the user must define the time range for data export. Using a time window allows for the data to be animated from the tile cache. If there are many profiles in the unsteady flow simulation, there is an option to skip profiles in the list so the event range can be visualized without having to write out more data than is needed. If the inundation area associated with the maximum water surface is exported by default.
Viewing RAS Tiles
To utilize the RAS Tiles option, you can view the RAS Tiles data through a web browser hosted on a web server. The RAS Tiles server software was developed using open source tools. Hapi (hapijs.com) is used for the server framework and Leaflet (leafletjs.com) is used for the interactive mapping capability. The RAS Tiles server software is available from the HEC-RAS software downloads web page.
Instructions for local viewing are provided below.
- Download and unzip the “RASTiles_server.zip” file from the HEC-RAS software download web page for the appropriate Windows Operating System (32- or 64-bit).
- Copy the “rasplanshortid.db” files to the “tilesets” folder in the RAS Tiles directory.
- Start the tile server by running the “RASTiles.bat” script.
- This can also be accomplished by starting the tile server using the command line by navigating to the install directory and typing “node server” and hitting Enter.
- Open the “RASTiles.html” file in a web browser.
- This can be accomplished by opening a web browser and typing
“http://localhost:3000/”
- This can be accomplished by opening a web browser and typing
- If additional tile datasets (.db files) are to be viewed, the server will need to be restarted, after copying the .db files into the “tilesets” folder.
- To stop the web server, close the CMD prompt.
- Start the server as discussed in Step 3.
Instructions for web server hosting are provided below.
- The server must be started as described for local viewing.
- An Information Technology specialist will need to set up server security/policy so that the web server may be accessible via the web to mobile clients.
- Provide the web client with the URL to the web server. Note, the server address will be shown in the CMD prompt window.
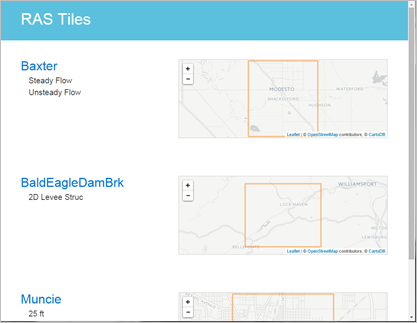
The web browser is launched with the “RAS Tiles” title at the top of the web page. Individual RAS Project datasets in the ”.db” files are available for display as indicated by the RAS project name with sub headings listing the available Plans. An overview image is shown on the right of the webpage, as shown below.
Selecting a RAS project will show a new web form with datasets for each Plan that has been exported based on the database files in the “tilesets” folder. The web interface, shown the figure below, will allow you to select the Opacity for the RAS maps, animate through the list of output maps, pan, zoom, and select from the list of background layers.
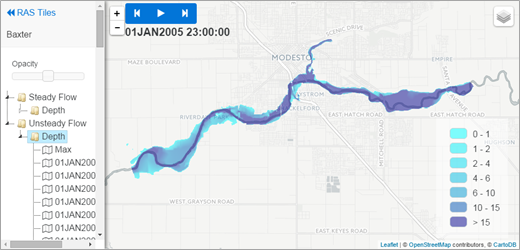
| Map Tool | Description |
|---|---|
| RAS Tiles | Takes the user back to the RAS Tiles pages listing each RAS project with available map layers. |
| Play, Stop, Forward, and Back | The animation toolbar allows the user to step through RAS profile results. This tool is active if once a map type (“Depth”) for a particular Plan is selected. |
| Zoom In, Zoom Out | The Zoom Toolbar allows the user to zoom in or out on the data. The mouse wheel will allow for zooming. Double-clicking on the map will also zoom in. |
| Background Layers | Available background layers will provide the user with options to view street names and aerial imagery. Currently, Open Street Map data is supported. |