Geospatial capabilities are available in HEC-RAS to assist the hydraulic engineer to create and refine the model geometry and analyze computed results. This capability to visualize the combination of geometric data (terrain, river networks, cross section locations, cross section parameters, 2D meshes, etc.) and simulation results (water surface depths, velocities, etc.) allow HEC-RAS users to more readily identify hydraulic model deficiencies and make improvements. This document will discuss how to use the HEC-RAS Mapper to performing mapping of model output to view and compare results, as well as how to publish map products.
The HEC-RAS Mapper module is an interface accessed from the HEC-RAS program. The RAS Mapper is intended to provide visualization of HEC-RAS simulation results along with pertinent geospatial data to assist users in improving hydraulic models. The HEC-RAS Mapper module is accessed using the GIS Tools | RAS Mapper menu item on the main HEC-RAS program interface or by pressing the  RAS Mapper button, shown below.

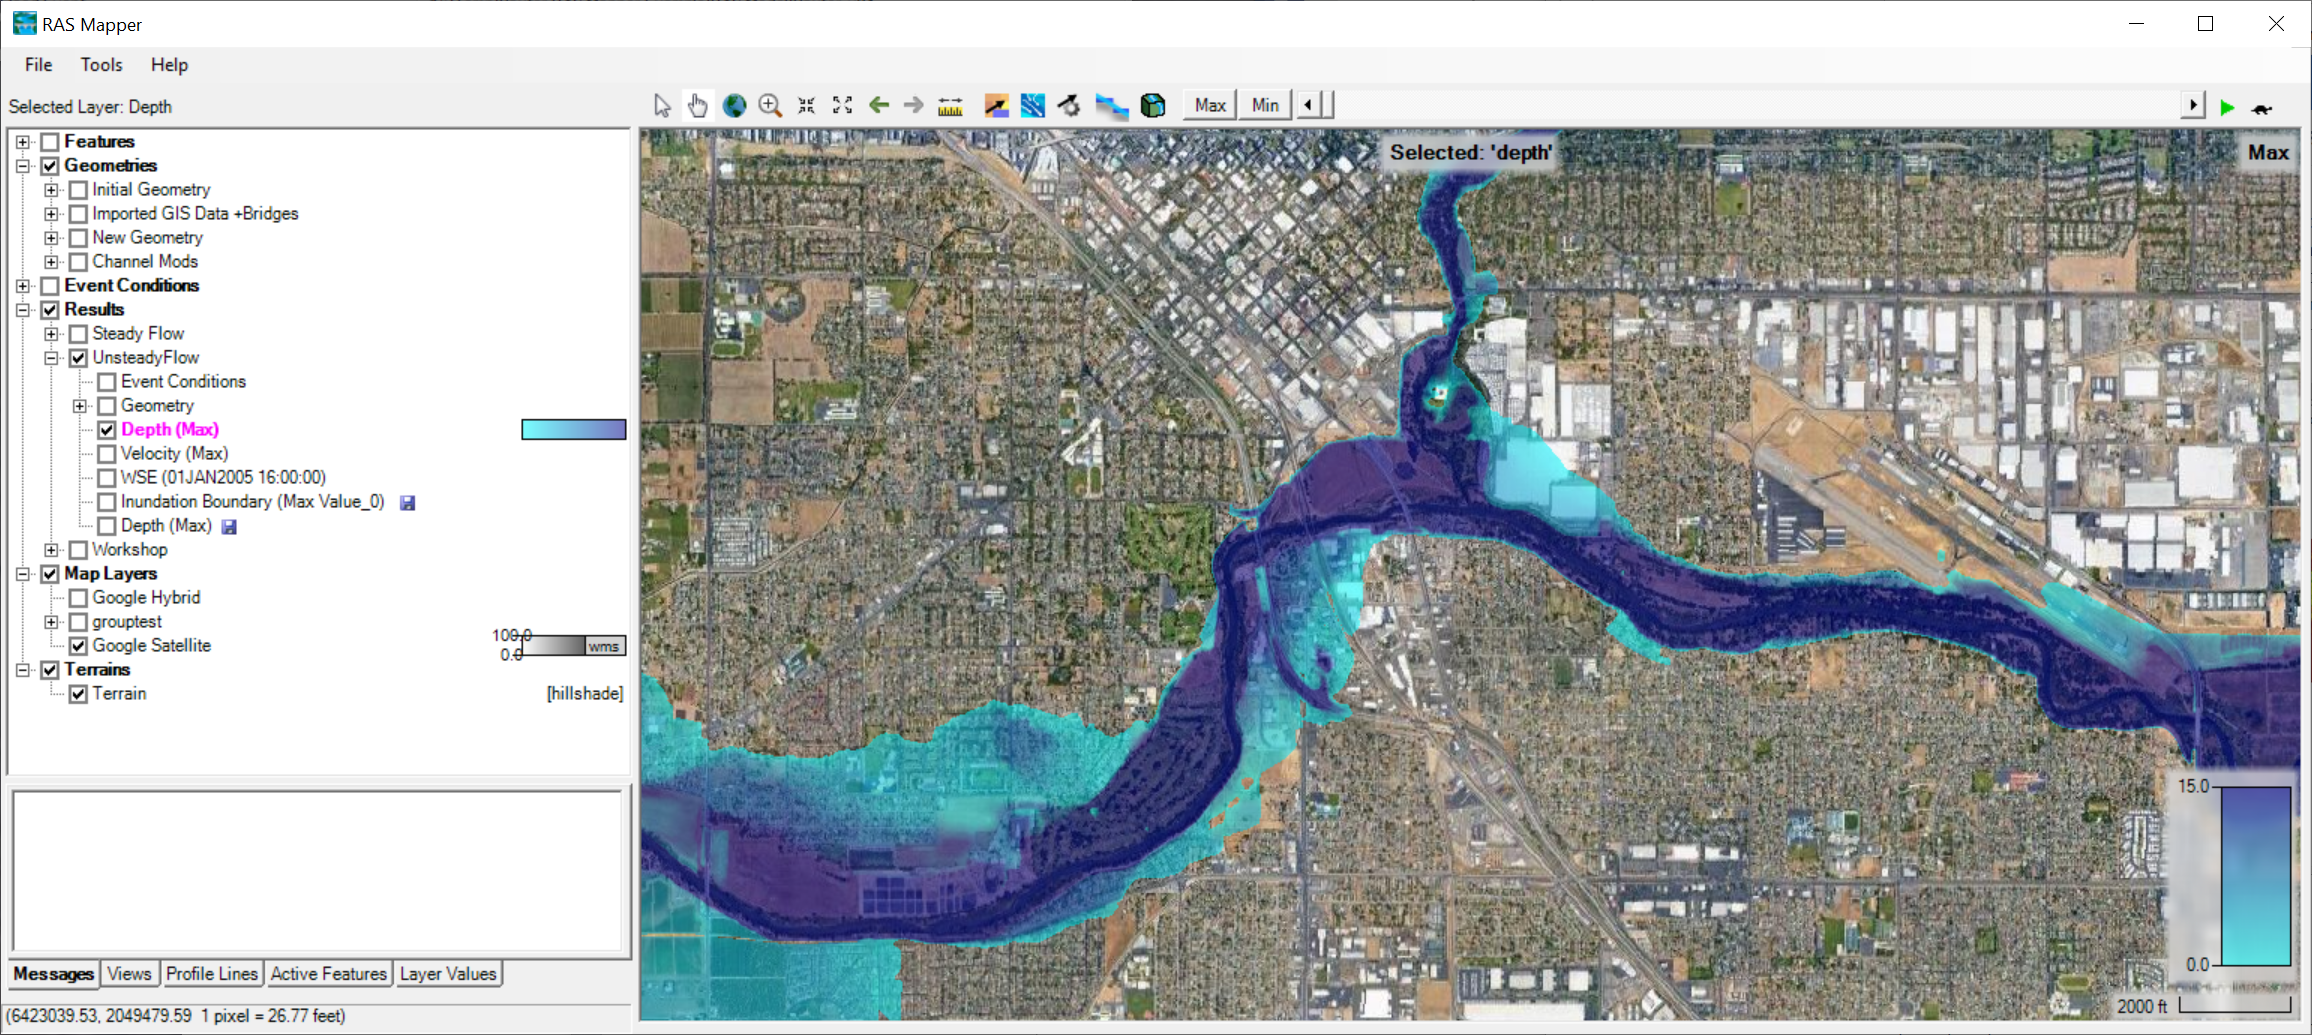
When RAS Mapper is launched, the Layer List will show all of the main data used to create model geometry and perform simulation runs. This data is organized into the Geometries, Results, Terrains, and other group layers. Specifically, for HEC-RAS simulation results, a data is grouped under the Results group using the simulation Plan Short ID. For the example shown in the figure below, there are two simulation runs: "Steady Flow" and "Unsteady Flow". Each Result is self-contained - the event conditions data, geometry, and resulting maps are all stored (and organized) within the same dataset. RAS Mapper provides tool to analyze these results by changing the rendering order, changing the layer symbology, animating data by profile, interactive data querying, creating results profiles, and may other options.