Download PDF
Download page Reference Locations.
Reference Locations
Reference locations are used to specify locations where output will be written during the simulation. Simulation results are computed for the spatial location during the computations based on the mesh cell or cell face and stored in the output HDF for the simulated plan. The results can then be accessed in either in RAS Mapper or using the Plot Stage and Flow Hydrographs button from the main RAS interface.
Reference locations are created in the RAS Mapper Geometry layer. RAS stores information associated with reference locations by feature name. Therefore, when creating a reference location, you will be asked to provide a unique Name.

Once data has been created in RAS Mapper, reference locations can be used to specify Observed Data tab from the Unsteady Flow Data editor.
- Reference Points - Observed Stage and High Water Mark Data
- Reference Lines - Observed Stage, Observed Flow, Rating Curve, and High Water Mark Data
Reference Points, Lines, and Areas must be created in RAS Mapper prior to simulation. Results are computed during run-time based on the cells and cell faces contained within the Reference Points, Lines, and Areas.
Currently, Reference Points, Lines, and Areas are only supported for single 2D Flow Areas or 1D area - they can NOT overlap multiple areas.
Reference Points
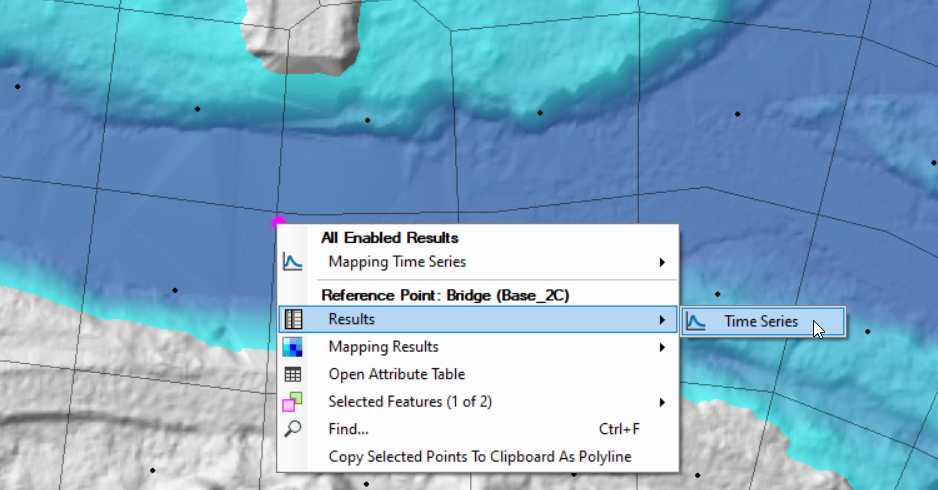
Reference Points are created as a point feature in the Reference Points layer. Information is computed based on values from the closest cell computation point and written to the Reference Point location. Results are accessed using the View | Stage and Flow Hydrographs or by selecting the Plot Stage and Flow Hydrograph button from the main RAS interface. From RAS Mapper, you can access the plot from the Results group by selecting the Reference Points layer, right-clicking on the point, and choosing Results Time Series | Hydrographs option.
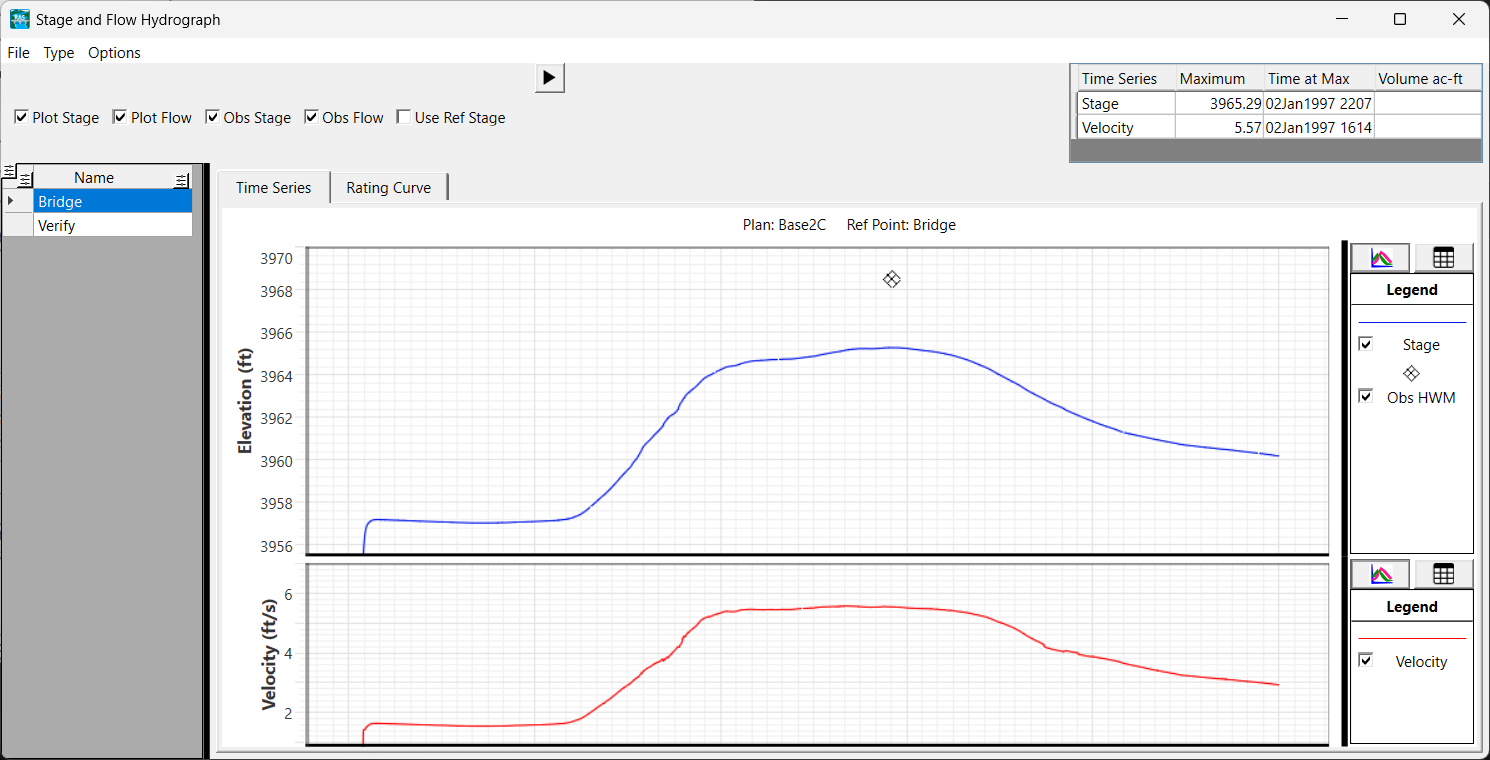
The Stage and Flow Hydrograph plot will open with the Type set to Reference Points. Options for plotting the Velocity and velocity Direction are also available. Shown below is the time series plot for a reference point showing Stage, Observed High Water Mark, and Velocity data.
Reference Lines
Used to display flow and flow-weighted stage time series and velocity, Reference Lines are instrumental in calibration of a 2D model. Reference Lines are also used for performing floodway encroachment analysis to evaluate and compare model results. Results are computed along faces from cells that the reference line intersects. Each cell face is projected onto the Reference Line to determine (weight) how much of the cell face to use for the portion of the line cutting through the cell. Flow and velocity are then computed from the weighted face length. An example of face selection as traversed along a Reference Line is shown in the figure below.

Values from Reference Lines are computed based on the values from the nearest faces (using projected length correction) along the Reference Line. Therefore, Reference Lines should be created along faces in areas of 1D flow, for the most accurate results.
Reference Lines are created as a polyline feature in the Reference Lines layer. Results are accessed using the Plot Stage and Flow Hydrograph button from the main RAS interface or by selecting the Reference Lines layer, right-clicking on the line of interest, and choosing Results Time Series | Hydrographs option from the Results group in HEC-RAS Mapper.

The Stage and Flow Hydrograph plot will open with the Type set to Reference Lines.

Reference lines are also accessible by right-clicking on a Result and selecting the Plot Results Profile menu item.

The plot window will appear with the list of reference lines available for selection. As you choose a reference line, the plot will update.

Use the animation bar for the Profile Plot in RAS Mapper or by pressing the Play button to invoke a separate animation tool.
To change plot variables, select the Options | Variables menu option.

The "Water Surface (Flow Avg)" variable is the flow-weighted (averaged) water surface. The "Water Surface (Mapped)" is the water surface elevation extracted from the mapped (interpolated) water surface elevation surface and is dependent on the render mode.
Generation of Reference Lines
Reference Lines best represent the water surface in area where flow is one-dimensional and will provide hydrograph output that computes a flow-weighted (averaged) water surface and velocity. Therefore, creating Reference Lines in areas where the water surface is one-dimensional and perpendicular to the flow lines is recommended. To assist users in creating Reference Lines, there is a Plot Option on the Velocity layer.

The Track Transverse Velocity at Cursor will create a line perpendicular to the velocity as you move your cursor over the velocity surface.
![]()
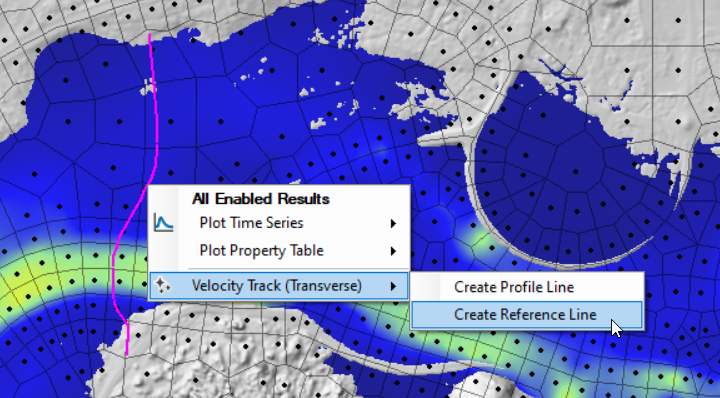
When you have identified a location to create a reference line, right-click and select the Velocity Track (Transverse) | Create Reference Line menu item and the Reference Line will be created in the base geometry group of type "Transverse".
You can create Reference Lines interactively using the WSE map and turning on the Plot Contour at Cursor plot option. After identifying the location of interest, right-click and choose the Contour | Create Reference Line menu option.

Longitudinal (river lines) can be created using the same velocity surface, however, by choosing the Track Longitudinal Velocity at Cursor option. Longitudinal lines are useful for generating Profile Plots.
Reference Areas
Reference Areas can be used to evaluate Flow In, Flow Out, and Volume for the specified area. Reference Areas are created as a polygon feature in the Reference Areas layer. Results are accessed using the Plot Stage and Flow Hydrograph button from the main RAS interface or by selecting the Reference Areas layer, right-clicking on the line of interest, and choosing Results Time Series | Hydrographs option from the Results group in HEC-RAS Mapper.

When computing results for Reference Areas, the computation point (cell center) determines whether the cell is used in the computation. If the computation point is within the reference area, the entire cell is included in the computation. Therefore, for large computation cells, the edge of the Reference Area polygon should follow the edge of the computational mesh cells - otherwise, volume computations may not be accurate (volume could be over/underestimate). An example demonstrating cell inclusion along the edge of a reference area is shown below (green cells are included, red cells are not).

Wetted area and volume can also be computed within RAS Mapper using the rendered Depth results raster. Right-click on the reference area and choose the Reference Area | Plot Time Series | Depth menu option (the Depth raster must be turned on). A dialog (shown below) will appear, allowing you to choose the rasterization Cell Size and Map variable you would like to compute. The default cell size will be based on creating/sampling a raster that would be approximately 1 million cells based on the extent of the reference area polygon. Water surface rendering mode will affect results using this method, with horizontal rendering most accurately aligning with the Reference Area results viewable in the Stage and Flow Hydrograph window.

The computation will be performed using the rendered results map (using the specified render mode). As the computation is performed, the dialog shown below will report progress.

When complete, a time series plot of the computed map value will be shown.
