The Mapping Window is used for displaying the geospatial component (features) of a data layer. It is intended that the display will provide visualization of HEC-RAS results along with the geometric data that was used in performing the analysis. Tools, summarized in the table below, provide user interaction with the display to change the viewable extents and query data.
Tool
Description
Select
Selects the feature of interest. The feature will change to the highlight color. If a raster layer is selected the value for the selected grid cell is reported. Raster layers: the value for the current mouse location will be interactively displayed.
Pan
Interactively drag the display window to view a new location. Raster layers: the value for the current mouse location will be interactively displayed.
Zoom In
Zooms into the region identified with a bounding box.
Zoom In (Fixed)
Zooms into the center of the viewable extent reducing the viewable area by half.
Zoom Out (Fixed)
Zooms out from the center of the viewable extent to double the viewable extent.
Zoom to Entire Extent
Zooms to the maximum viewable extent of all the loaded data layers.
Zoom Previous
Zooms to the previous map extents.
Zoom Next
Zoom back to the previous map extents prior to using the Zoom Previous option.
Measure Tool
Measure the distance in map units.
Mouse Wheel
Zoom in with forward mouse wheel roll, Zoom out with backward mouse wheel roll.
Render Mode
Changes the water surface rendering mode between Horizontal and Sloping water surface.
3D Viewer
Launches the 3D Viewer.
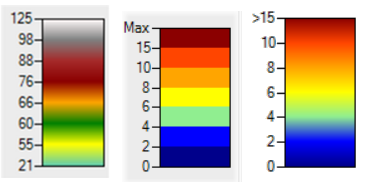
Legend
When raster layers are the Selected Layer, a legend will be drawn in the lower right corner of the Map window. The Legend will be based on the raster symbology as defined in its Layer Properties. When using the Discrete legend type, the largest value is labeled as "Max". When using the Stretch legend type, the largest value in the legend will be displayed. You can add a ">" symbol to the largest value using the Overlay Options for the General Settings. Example legends are shown below (stretched, discrete, discrete with ">" value).
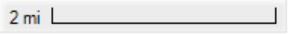
Scale Bar
A scale bar with be drawn in the lower right corner of the Map window. It will resize as the user zooms to various scales. The scale bar will auto size to predefined scales.
North Arrow
A North Arrow will be drawn in the upper right corner of the Map window.