Download PDF
Download page OSI (Operation Support Interface) Tutorial.
OSI (Operation Support Interface) Tutorial
General
The OSI was developed to bring a spreadsheet like interface to ResSim. The OSI works on a column row format and also allows for multiple tabs. This allows the user to see column formats of any resSim input and output and can make reservoir release overrides and changes to inflow hydrographs to improve or replace the releases determined by the resSim rules logic. The user can also write scripts that can perform mathematical calculations on this tabular data, which can direct the behavior in the next ResSim compute similar to the way cells can be programmed in a spreadsheet. This gives the user a much more hands on access to making large scale changes to the inputs of the ResSim model from one easy to use access point.
The OSI allow the users to quickly modify reservoir inflow and outflows and recompute ResSim based on the knowledge of the experience water manager. The OSI has tools to quickly and efficiently edit inflows via graphical editor as well as several tabular tools.
OSI Components
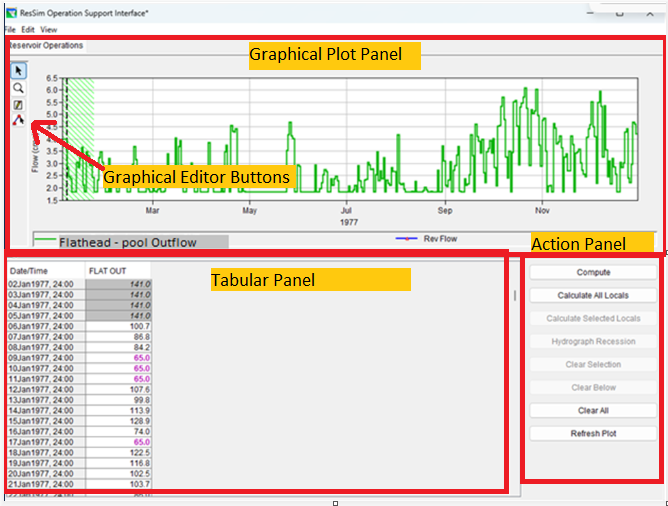
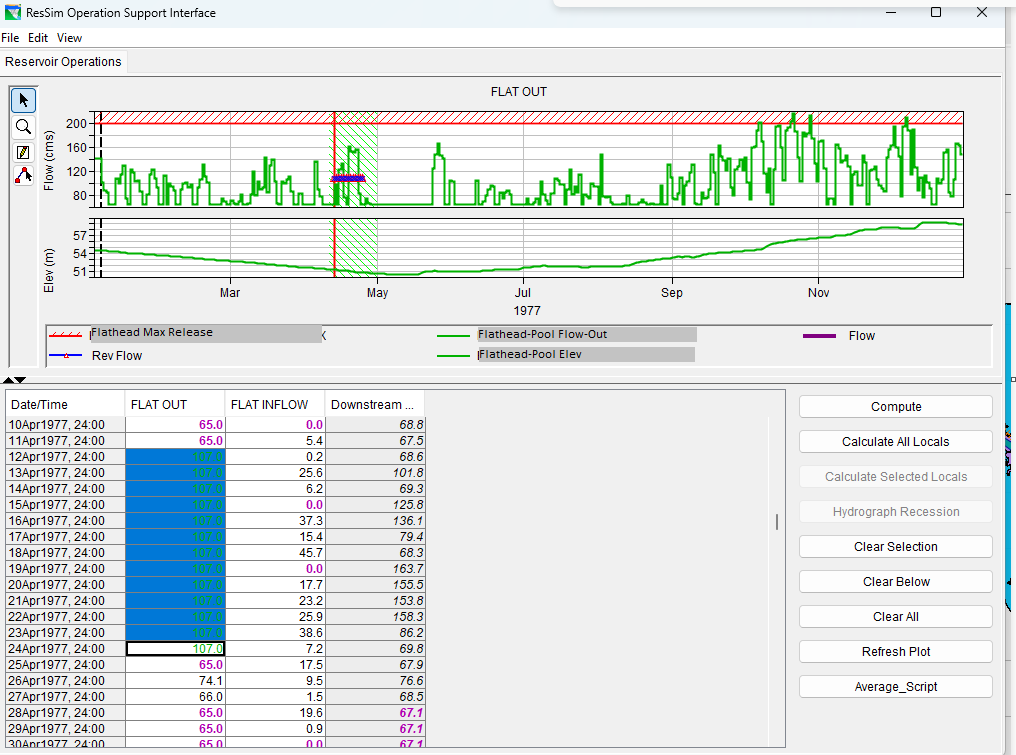
The OSI has a graphical plot panel, a tabular panel, and an Action Panel shown in the image below. The tabular panel is the most important feature and allows the user to view, compute, and edit ResSim reservoir releases and watershed inflows. Columns in this table can be edited cell by cell or using HEC's standard "Fill" features that allow multiple selected cells to be filled by a linear fill, repeat fill, add a constant, and multiply factor. Changes made in the table will immediately plot as an override in the graphical plot panel for the user to visually inspect. The user can also change releases or flows via the graphical editor buttons. Selecting the standard HEC graphical editor button allows the user to draw in any proposed changes. These changes will immediately show up in the plot and also in the tabular panel. The Action Panel shows the buttons that perform standard operations like Compute, which will recompute the ResSim model with any changes made within the OSI. Other buttons help the user make the user more efficient when working within the OSI.
Setting up OSI
Beginner Setup
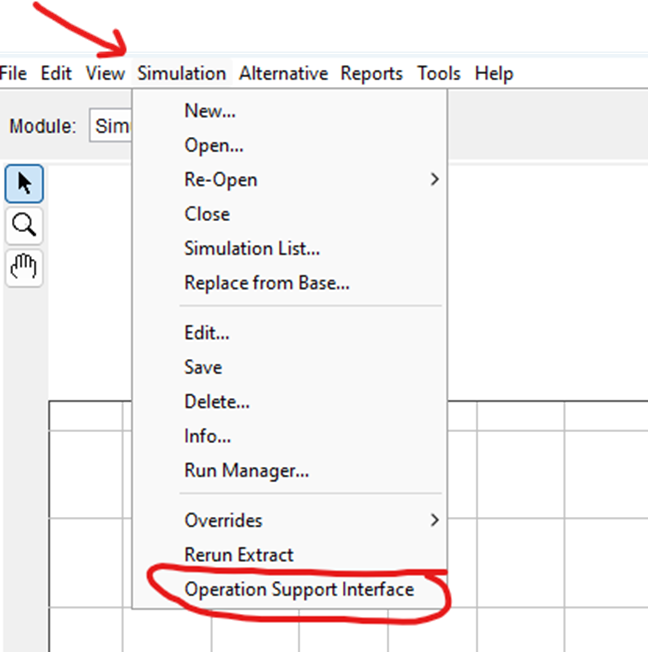
Creating an OSI requires a computed simulation. Once the simulation is complete, create the OSI by clicking the 'Simulation' dropdown. See the screenshot below.
Adding a Tab
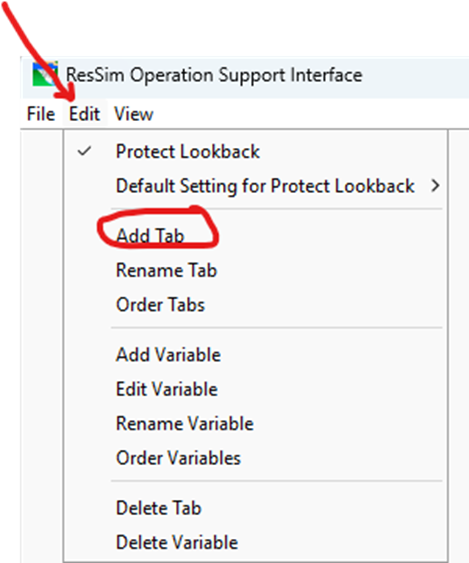
This will open a blank OSI. Click 'Edit' and 'Add Tab' as shown below. Provide the tab a name. The name can be changed later if needed.
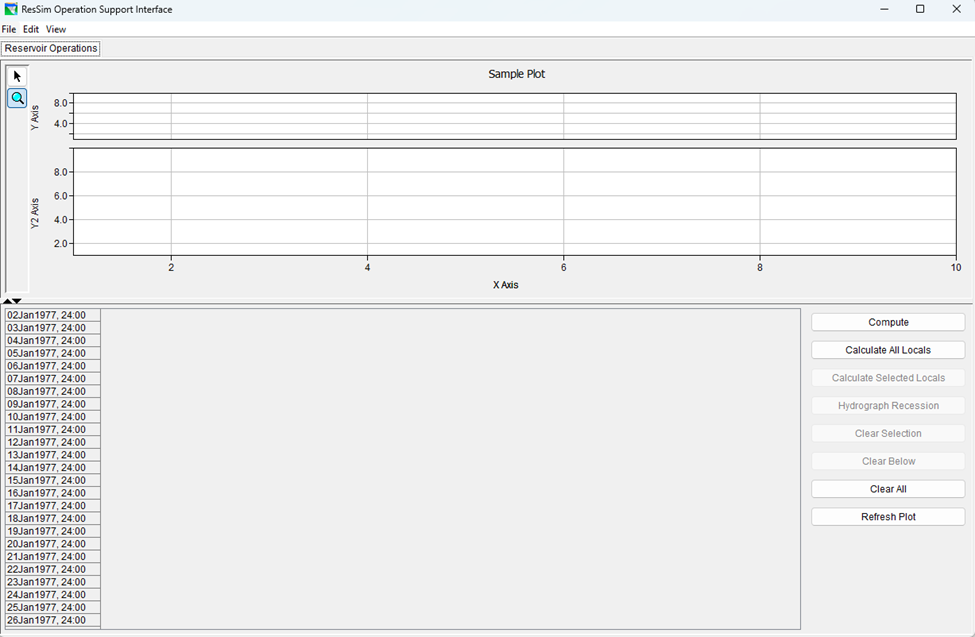
The OSI will now show a blank plot area on top and an empty table below. Multiple tabs can be used to compartmentalize different reservoir or basin information and to avoid having an extremely large scroll if an OSI requires numerous columns. See the screenshot below.
Variable Editor / Adding Columns
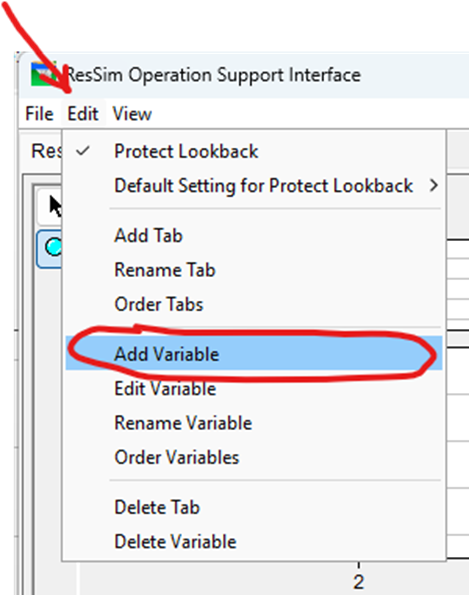
Now begin adding columns of ResSim data to your OSI tab. Click 'Edit' and 'Add Variable'. Give the Variable/Column a name that corresponds to the data you intend to populate into that column. Example - If you plan to put Flathead Reservoir Release data into this variable/column, suggest naming it "Flathead Outflow" or "FLAT OUT". This field is text and can be changed later. See the screenshot below.
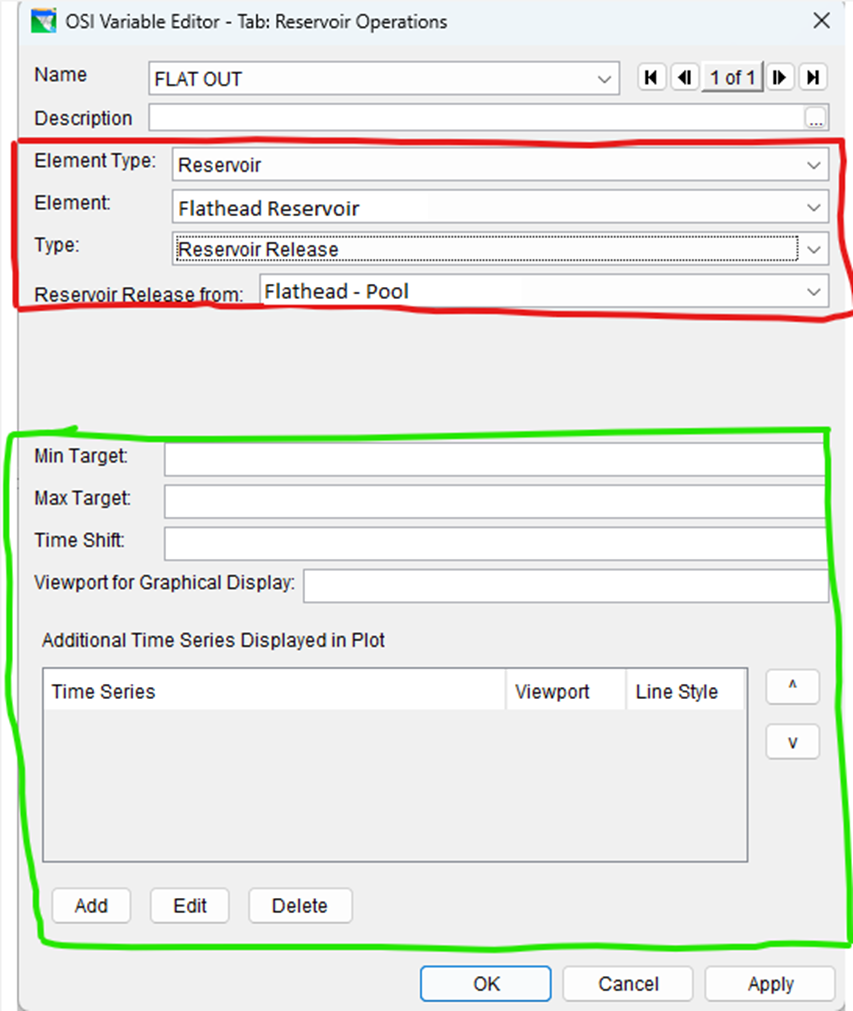
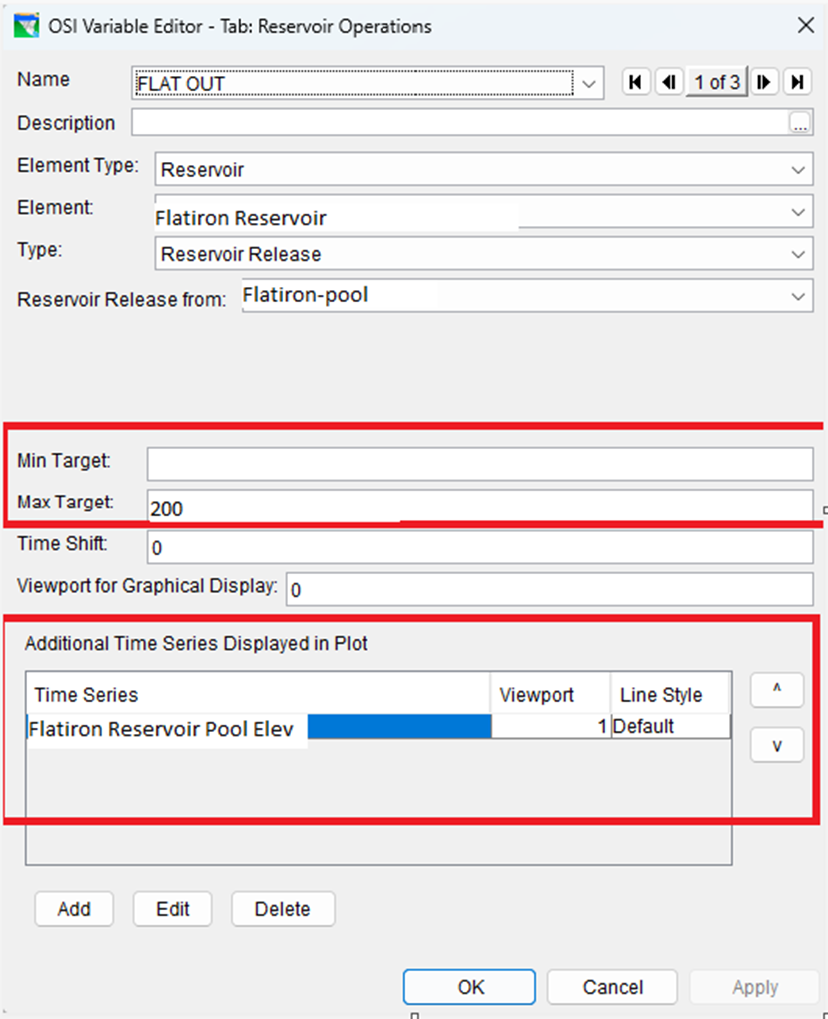
'Add Variable' launches the "OSI Variable Editor" shown in the screenshot below. The OSI Variable Editor is one of the primary setup locations for the OSI columns. The fields in the red box are required. This connects the column to the resSim component chosen by the user and determines whether the column is for visual purposes or if the column can be used to modify ResSim inflows or releases. The items in the green box are optional and improve the display of data for the column. This area can add things like shaded areas for min/max targets and additional timeseries to be displayed alongside the required data selected above.
Setting up a variable/column to modify releases (or pool elevation)
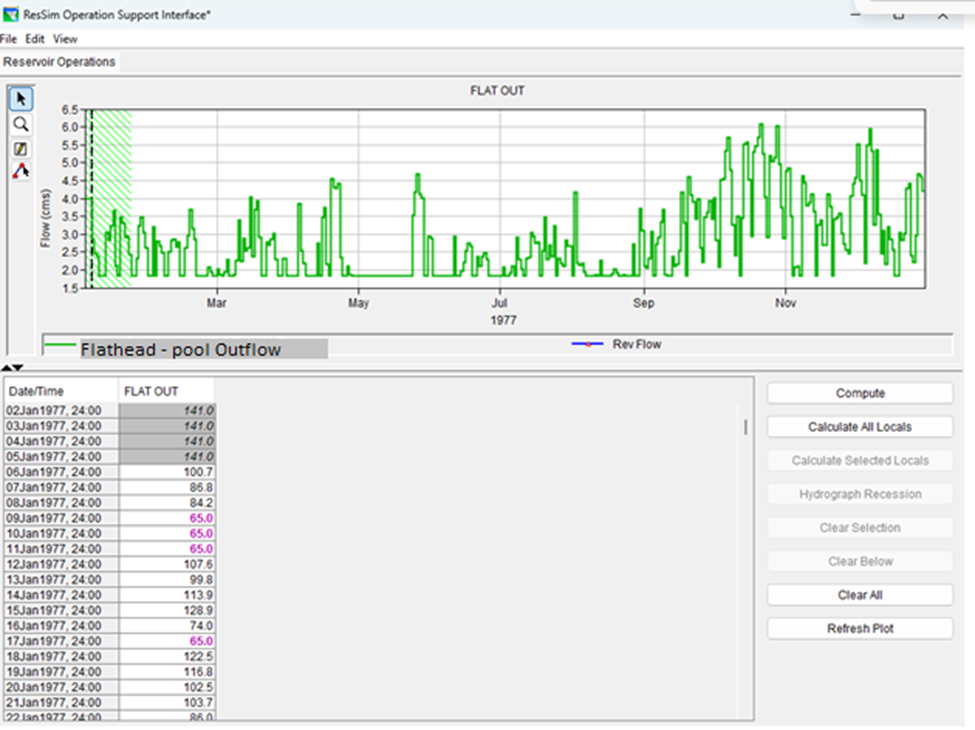
Most resSim users want to use the OSI to visualize results and then modify reservoir releases. To do this, the setup shown in the image above should be followed. The setup above will provide a column that allows the OSI to change the releases via this column. These release overrides will be used during the next resSim compute. The image below shows how the OSI would look after configuring this release override column. The column can now be edited via the graphical editor button or by changing the table entries. The user can also change the 'Type' to 'Elevation Target'. This will set a ResSIm elevation override where on the next compute ResSim will modify the outflows from the reservoir as it attempts to meet any elevation changes proposed by the user. This 'Elevation Target' is used less often than the Reservoir Release targets.
Setting up a variable/column to modify inflows
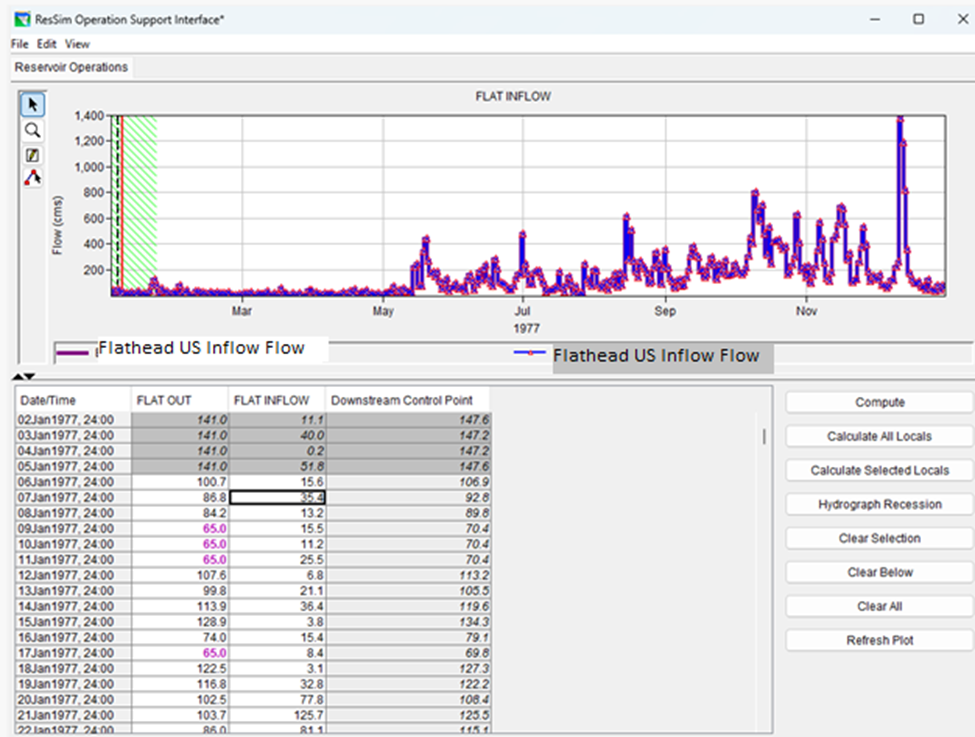
Users often want the ability to make edits to inflow hydrographs into reservoirs and river systems. Especially when making long-term forecasts it can be useful to adjust the recession limb of a HMS hydrograph to better match the expectations of a seasoned water manager. A setup like the one below shows how to configure this up for a upstream reservoir junction. The required fields are in the red box and the optional fields are shown in the green box.
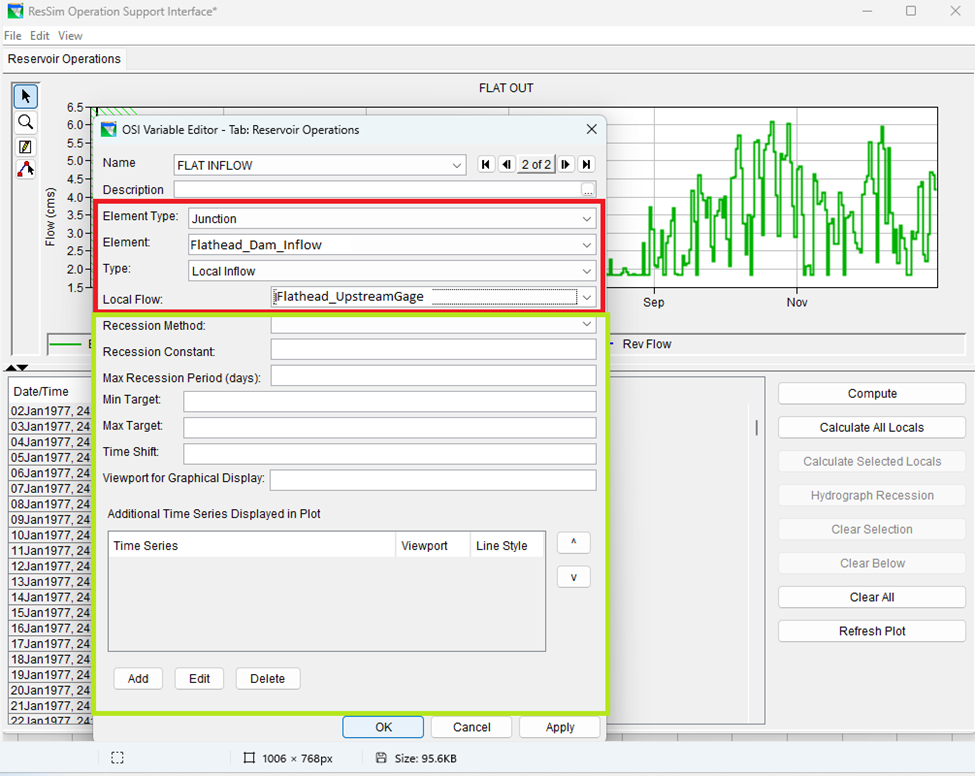
Once this is set up your inflow junction will look like what is shown in the screenshot below. All flows in the simulation period can be edited graphically or by modifying the table entries.
Setting up a variable/column with computed values
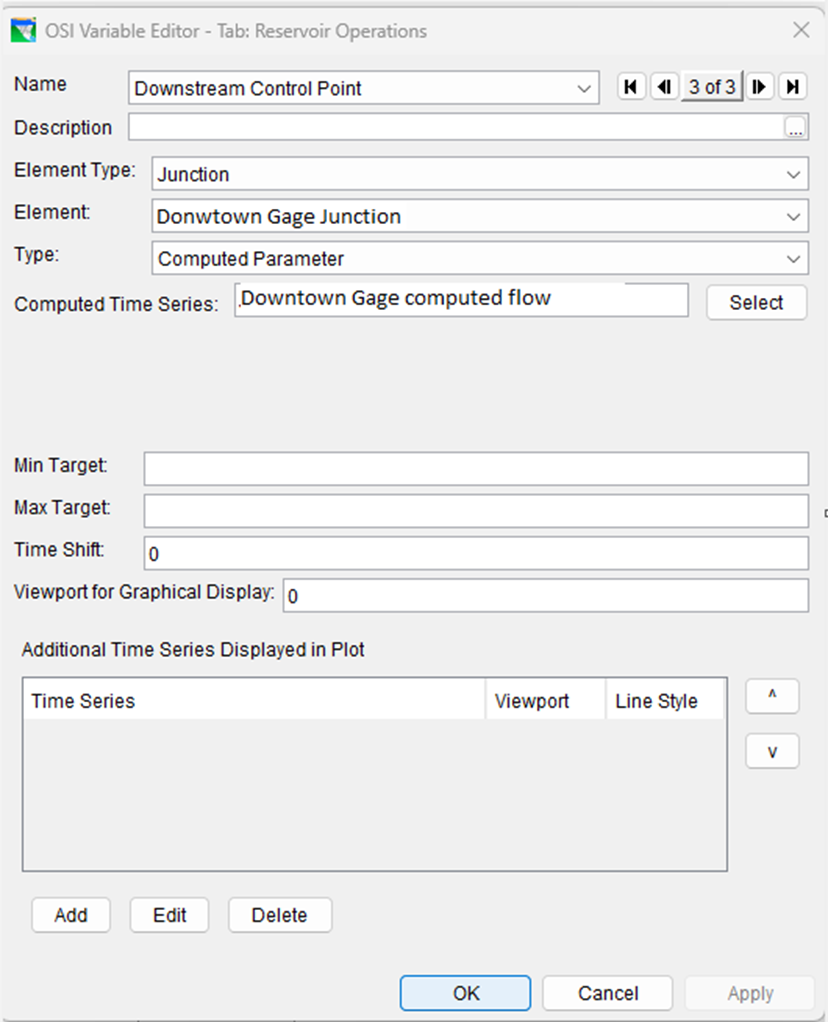
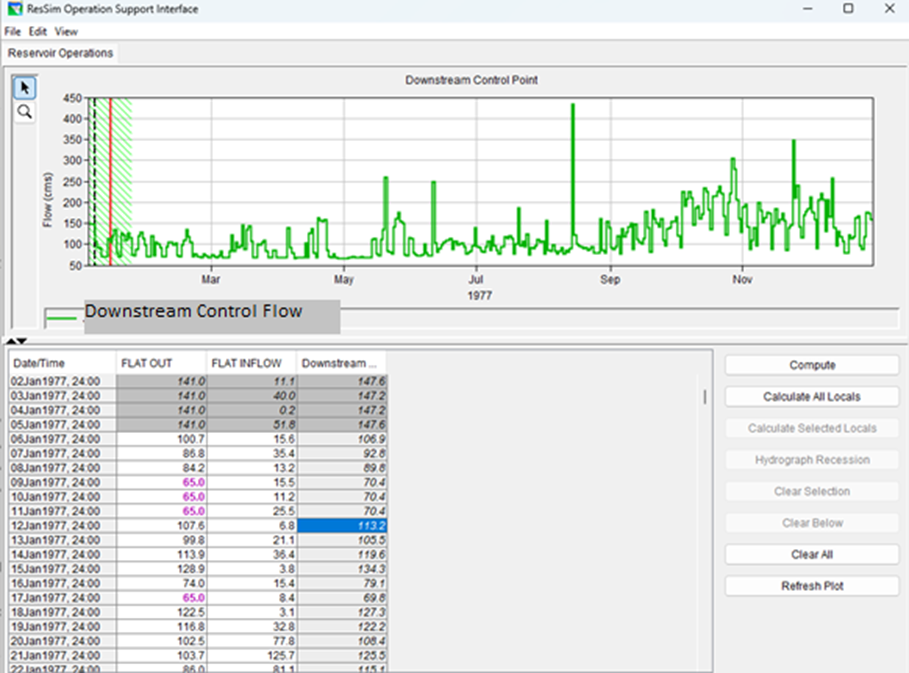
Users may want to display values computed by resSim that cannot or should not be modified. A 'view only' variable/column can be added by selecting the 'Type' 'Computed Parameter' from the 'Variable Editor'. This will allow the user to select a ResSim timeseries output to be displayed in the OSI as shown below. Note the column background is greyed out and there is no graphical editor tool, both indicating the numbers in this column cannot be changed. The images below show the Computed Parameter setup how it will look in the OSI.
SAVING THE OSI
Once the user has finished the setup, click 'File, Save'. This will save the OSI into this simulation. THE NEXT STEP IS REQUIRED FOR USE IN FUTURE SIMULATIONS. Perform a 'Save to Base' of the alternative. This will save the OSI to the Reservoir Network for use in future simulations.
Using the OSI and Action Panel
The action panel is located on the lower right side of the OSI and contains numerous buttons that can compute ResSim or modify the information in the OSI table and plot. The most important buttons are explained below.
Compute - This will recompute ResSim and will include any changes to the OSI variables in the compute. Any changes to the releases or inflows made in the OSI by the user will now be picked up and used in the ResSim compute.
Clear Selection - The cells selected in the OSI table will be cleared and ResSim will recompute with these updated values. For a release override column this will return the selected cells back to the flows computed by ResSim. For a column of ResSim inflows the selected cells will be set to 0. The recompute will occur with these adjustments made. The selection could be a single cell in one column, or many cells spanning several columns.
Clear Below - This clears the overrides and inflow values from the selected cell to the end of the simulation and will force a ResSim recompute after clearing. This is very useful after making several changes to a release overrides column and the user wants to return the values back to the original releases calculated by the ResSim logic. Using Clear Below with inflow data will set all values below the selected cell to '0', which has a smaller use case.
Clear All - This clears all editable columns.
Refresh Plot - Forces the plot to refresh with any unapplied changes from the table or the ResSim recompute.
The other buttons are used in a specific river forecasting system that calculates observed local flows between gaged locations. If you'd like more information on these, please add a note in the comments.
Intermediate Setup
The information above sets up a basic OSI that will allow the user to visualize and manipulate flow and release information. The OSI can be further improved to better display information and help the user visualize the operations.
Adding multiple plot displays and Max/Min zones
Displaying multiple data sets on one plot or adding additional plot windows can increase the OSI's effectiveness. The screenshot below shows how the user added a elevation plot to be displayed in another plot window and added a max flow target. The next screenshot shows the results of this setup. The first screenshot shows where the user selects viewport zero for graphical display and viewport 1 for the elevation plot. If the elevation plot had been set to 0, both lines would have been plotted in a single viewport. Changing the graphical display viewport from 0 to 1 would have put the flow plot on the bottom. The user can move these different lines around as needed to make each OSI display as useful as possible.

Customize and Change the OSI
The OSI can be changed or adjusted in many ways. The image below shows the list of actions in the 'edit' toolbar. Each of these actions is explained below.
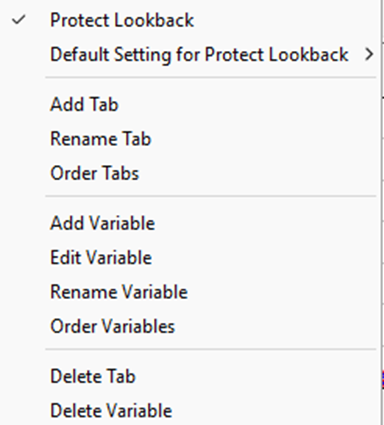
Protect Lookback - This stops the user from making changes to flows between the lookback date and start of simulation. This set of data is greyed out in all columns. Unchecking this will allow the user to change this data in any column where changes are allowed.
Default Setting for Protect Lookback - self explanatory
Add Tab - self explanatory. The user can add as many or few tabs as needed for the application.
Rename Tab - self explanatory
Order Tabs - Allows user to change the order of the tabs via a pop-up box.
Add Variables - Adds additional columns/variables
Edit Variable - Opens Variable Editor which allows user to change column/variable characteristics
Rename Variable - self explanatory
Order Variables - self explanatory
Delete Tab - self explanatory. Deletes whichever tab is active.
Delete Variable - self explanatory. Deletes whichever column is selected.
Customizing Layout and Format
The user has numerous options for changing the look and feel of the OSI. Most of this is done via the 'View' toolbar. The options in 'view' are shown below and more explanation is also provided.
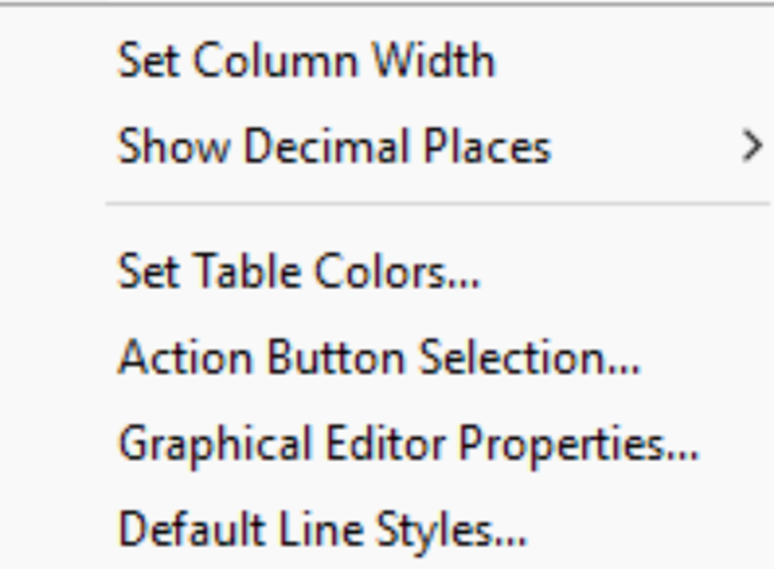
Detailed information on the items below will be provided upon request in the comment box at the bottom of the page.
Advanced Setup
The OSI and ResSim can be further customized by creating scripts that can use the information provided within the OSI table to improve reservoir operations. This allows the user to best replicate a spreadsheet's ability to set up formulas for setting the values in each cell. This formulization is produced by writing python scripts. Scripts are written in the resSim Script Editor Window. Once ready for testing the scripts are connected to the OSI via the Action Panel. The OSI scripts can then be used whenever the user needs to modify the contents of the OSI table. The steps to set up and activate an OSI script will be shown first. Followed by a short example script. After that information containing the original list of OSI command functions will be listed. The example script used below can be downloaded here.  Average_Script.py
Setting up an OSI Script
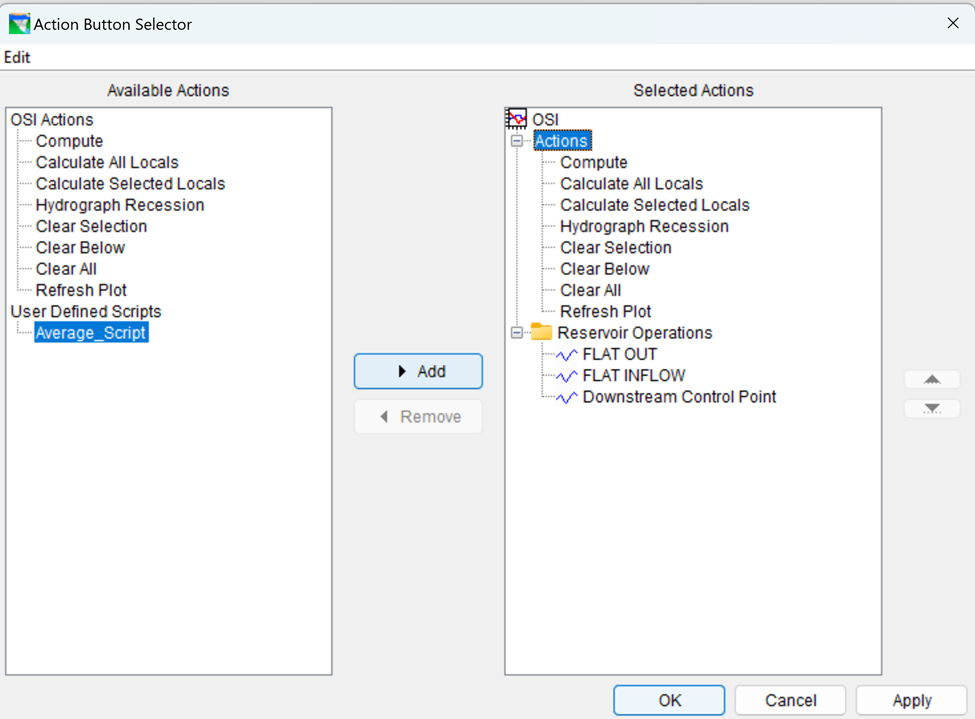
The User writes their script in the ResSim script editor. Once the script is written go to the OSI's 'View' menu and select "Action Button Selector". This will bring up the box below, which allows the user to add or subtract buttons shown on the Action Panel of the OSI. The lower left corner shows 'User Defined Scripts'. The Average_Script is an example script written for this demonstration. To load the Average_Script as an Action Button, select Average_Script from the left panel and "Actions" from the right panel as shown in the screenshot below. The "Add" button in the middle should become selectable. Click "Add" and "Average_Script" will be moved into the "Actions" list. Hit "Apply" then "OK".
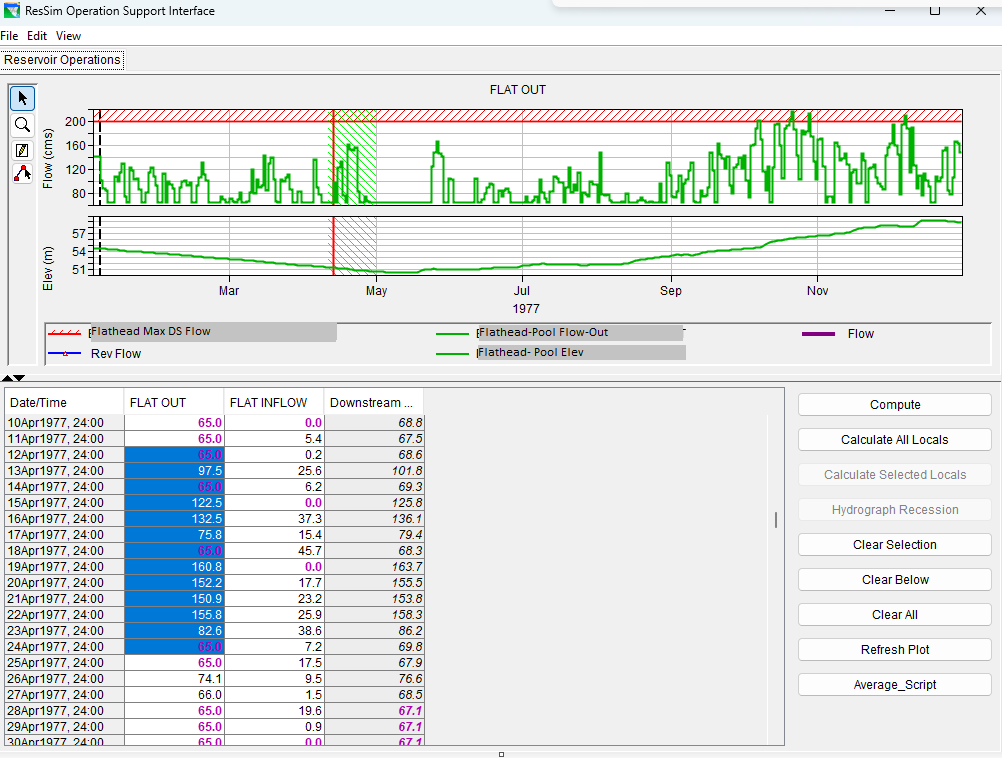
The "Average_Script" button will now show up in the Action Panel of the OSI. When clicked, this script will average the cells selected in the OSI table. The example shows averaging the next 10 values starting on 12Apr1977. Hitting ok will calculate the average the selected cells and write the average value into these cells in the OSI table. See the first image below showing this setup and the second image showing the scripted releases showing up in the first column and the top plot in blue. The user could then make additional changes to the releases before hitting 'compute'. If the user preferred to recalculate immediately after running the script, the user could add the .recompute command and the script would force the recompute without the user hitting a second button. The Average_Script is attached to this page for your use.
Writing an OSI Script
OSI scripts ar written in python/jython. Scripting is driven by performing calculations based on a cell's row and column index. Both the row and column index start at 0.
A script first requires identifying the OSI and which Tab the script should operate on. This is first accomplished with pre-written function called getOSIWindow. This function is provided in the example and should be called during the setup. See this call and several others used in a typical setup.
SwitchToTab = False
OsiWindow = getOSIWindow(SwitchToTab) # OpSupportFrame
OsiTab = OsiWindow.getSelectedTab()
OsiTable = OsiTab.getTable() # OpSupportTabPanel$OpSupportTable
ActionPanel = OsiTab.getActionPanel()
Now that the OsiTable is established in the script the user can read and write information from the table. This is accomplished with the read/write functions shown below. Note the OSI is very particular about the type of data that is passed to it and does not provide informative errors when this is not followed. I believe float was the data type used when writing back to the OSI.
variable = float(OsiTable.getValueAt(counter, column))
OsiTable.setValueAt(float variable, counter, column)
Other very useful commands include pulling the location of the currently selected cell. These functions are listed below.
SelectedRows = OsiTable.getSelectedRows()
SelectedColumns = OsiTable.getSelectedColumns()
OSI Script Functions and Commands
The section below was taken directly from RMA's OSI contract document. Additional capabilities have been added since this was written and should be added as they become available.
Several of the existing computations associated with OSI action buttons are implemented as simple operations on the OSI editor table data (Hydrograph Recession for example). By providing a scriptable API on the OSI editor table, users would be able to create scripts that directly operate on the table data.
Scripts that operate on the OSI editor table will be ResSim Simulation Module Jython Scripts. As such, the scripts will have access to all of the API currently available for use from the ResSim Simulation Module to select and operate on ResSim Alternatives and model results. It will be necessary to call methods to access the OSI editor, possibly opening the OSI if it is not already displayed, before calling methods on the OSI tables.
The scriptable API would include the following functions.
Accessing the OSI
ClientAppWrapper.getCurrentModule() A static method that returns the active ResSim Module. When called from the ResSim Simulation Module, the method will return an object of the type RSimSimulationMode.
RSimSimulationMode.getRssRun() Returns the currently active RssRun. Will return null if no simulation is running.
OpSupportPlugin.openOSI(RssAlt alt) Opens the OSI instance (OpSupportFrame) for the given ResSim Alternative.
OpSupportPlugin.openOSI(RssRun rssRun) Returns the OSI instance (OpSupportFrame) for the given RssRun.
OpSupportPlugin.getOSI() Returns the currently open or last open OSI instance (OpSupportFrame). If no OSI instance has been opened, it will return null.
Accessing OSI Components
OpSupportFrame.getSelectedTab() Returns the currently selected tab (OpSupportTabPanel).
OpSupportFrame.setSelectedTab(int tabIndex) Selects the tab indicated by the given index for display and returns the corresponding OpSupportTabPanel object. Returns null if the tab does not exist.
OpSupportFrame.setSelectedTab(String name) Selects the tab indicated by the given name for display and returns the corresponding OpSupportTabPanel object. Returns null if the tab does not exist.
OpSupportFrame.getTab(int tabIdx) Returns the OpSupportTabPanel object with the specified index. Returns null if a tab with that index does not exist.
OpSupportFrame.getTab(String tabName) Returns the OpSupportTabPanel object with the specified name. Returns null if a tab with that name doesn’t exist.
OpSupportTabPanel.getTable() Returns the table associated with the tab.
Accessing and editing table data
OpSupportTablePanel Methods, note that row and column indexes range from 0 to numRows-1 and numColumns-1 respectively, following the Java array indexing convention.
getRowCount() Returns the number of rows in the table.
getColumnCount() Returns the number of columns in the table.
getSelectedRow() Returns the currently selected row. Returns -1 if no row is selected.
getSelectedColumn() Returns the currently selected column. Returns -1 if no column is selected.
getValueAt(int row, int col) Returns the value of cell identified by the given row and column as a double. Returns RMAConst.UNDEF_DOUBLE if the cell does not contain a valid value.
setValueAt(double val, int row, int col) Sets the value of the cell identified by the given row and column to the given value. If the given row or column id is outside of the table range, or the cell is not editable, nothing is done.
getHecTimeForRow(int row) Returns the HecTime object associated with the given row. If the row is out of the table range, the method returns null.
getRowTimeStepMinutes() Returns the time difference between rows in minutes, note that the time step will be the same between all rows.
getRowAtStartOfForecast() Returns the row at the start of the ResSim forecast period.
getModelVariableAtColumn(int col) Returns the OpSupportModelVariable object associated with the given column. Returns null if col is out of the table range.
getColumnForModelVariable(String name) Returns the column id associated with the OpSupportModelVariable with the given name. Returns -1 if the no Model Variable is present in the table with that name.
setTableColoringOverride(boolean b) Setting the Table Coloring Override to true disables the automated assignment of table cell foreground and background colors and text fonts so that those properties can be set through a script.
getCellForeground(int row, int col) Returns the foreground (text) color currently set for the given cell. Returns null if the row or col is out of range.
getCellBackground(int row, int col) Returns the background color currently set for the given cell. Returns null if the row or col is out of range.
getCellFont(int row, int col) Returns the text font currently set for the given cell. Returns null if the row or col is out of range.
setCellForeground(int row, int col, Color clr) Sets the foreground (text) color for the given cell. Does nothing if the row or col is out of range.
setCellBackground(int row, int col, Color clr) Sets the background color for the given cell. Does nothing if the row or col is out of range.
setCellFont(int row, int col, Font font) Sets the font for the given cell. Does nothing if the row or col is out of range.
repaint() Under certain conditions, repaint might not be called automatically. It is best to call repaint after changing any color or font aspects of the table.
Accessing and Editing Column Variables
OpSupportModelVariable methods.
getMaxLimit() Returns the value of the Operation Support Variable Editor Max Target field as a double.
getMinLimit() Returns the value of the Operation Support Variable Editor Min Target field as a double.
getTimeShift() Returns the value of the Operation Support Variable Editor Time Shift field as an int.
getViewPort() Returns the Operation Support Variable Editor Viewport for Graphical Display field’s value as an int.
setMaxLimit(double d) Sets the Operation Support Variable Editor Max Target field to the specified value.
setMinLimit(double d) Sets the Operation Support Variable Editor Min Target field to the specified value.
setTimeShift(int i) Sets the Operation Support Variable Editor Time Shift field to the specified value.
setViewPort(int i) Sets the Operation Support Variable Editor Viewport for Graphical Display field to the specified value.
Triggering Actions
getActionPanel() Return the that holds the action and script buttons.
OpSupportActionPanel.() Run the Compute action as though the user clicked the Compute button.
OpSupportActionPanel.calcLocal() Run the Calculate All Locals action as though the user clicked the Calculate All Locals button.
OpSupportActionPanel.calcWithObsTSData() Run the Calculate Selected Locals action as though the user clicked the Calculate Selected Locals button.
OpSupportActionPanel.recessionMethod() Run the Hydrograph Recession action as though the user clicked the Hydrograph Recession button.
OpSupportActionPanel.clearTimeSeriesAll() Run the Clear All action as though the user clicked the Clear All button.
OpSupportActionPanel.clearTimeSeriesBelow() Run the Clear Below action as though the user clicked the Clear Below button.
OpSupportActionPanel.clearTimeSeriesSelected() Run the Clear Selected action as though the user clicked the Clear Selected button.
OpSupportActionPanel.refreshPlot() Run the Refresh Plot action as though the user clicked the Refresh Plot button.