Download PDF
Download page Workshop 4 – Multiple Rules Operation.
Workshop 4 – Multiple Rules Operation
Last Modified: 2023-02-08 07:37:53.342
Software Version
HEC-ResSim pre-release Version 3.5 will be used during the 2023 PROSPECT #098 course. Download here: https://drive.hecdev.net/share/YETr0az6
Workshop Instructions (PDF): Workshop 4 - Multiple Rules Operation.pdf
Download Initial Zipped Workshop: WS4_Start.7z
Download Zipped Workshop Datafiles: WS4_data.7z
Download Solution Zipped Workshop: Workshop 4 - Multiple Rules Operation_Solution.pdf and WS4_Solution.7z
Introduction
This workshop will demonstrate how to create downstream control function reservoir operation rules in HEC-ResSim and how to combine and analyze multiple operation rules in the same zone. The workshop will build off the Water Control Plan operation set created at the end of Workshop 3. Students will create different types of downstream control function rules and investigate how rule priorities in zones affect the release decision logic.
Problem Statement
The goals of this workshop are to:
- Create downstream control function reservoir operation rules in HEC-ResSim to represent several of the flow objectives listed for downstream locations in the Crazy Mountain Reservoir Regulation Manual,
- Assign operation rules to the appropriate zone and correctly prioritize rules within zones, and
- Identify the effects of operations on simulation results.
The rules we will explore are (from the Water Control Plan in Section III of the Crazy Mountain Reservoir Regulation Manual):
- At-Site water control plan operations (already created from Workshop 3).
- Water Supply Requirements – minimum flows at Rockville and Greenfield.
- Normal Flood Control Operation – channel capacity restrictions at River Point and Greenfield.
- (extra credit) Conjunctive-use for water supply at Greenfield. Supplement groundwater pumping with surface water from the river to maintain a conjunctive water supply of 3,500 cfs.
As in Workshop 3, rules will be added to a new operation set which will then be used by a new alternative. An outline of the operation sets and the associated alternatives is given in the table below. Please review the Water Control Plan, Crazy Mountain Regulation Manual, Section III, for detailed information on the rules before proceeding.
The rules, operation sets, and alternatives that you will be creating:
Task # | Network | New Rule | Operation Set | Alternative |
|---|---|---|---|---|
1 | 01 Standard | At-Site Rules | Alt 02 | |
2 | 01 Standard | Min Flow- Rockville | DSops-Rock | WCP-Rock |
3 | 01 Standard | Max Flow- River Pointe | DSops-Rock&River | WCP-RR |
| 01 Standard | Min Flow-Greenfield; | Water Control Plan | WCP-RRG |
5 | WithLoopy | Water Control Plan | WCP-Loopy |
Tasks
Task 1. Review Starting Watershed
Open the WS4 simulation in the starting watershed for the Workshop 4, WS4_Start. Run the simulation and use standard plots and reports to analyze the results for alternative Alt02 and answer the following questions.
Tip
This simulation contains one alternative with simulation results generated using the At-Site Rules operation set. This operation set contains all the at-site operation rules created in Workshop 4. In addition, the simulation time window has been extended by 3 days (flows during the extended portion of the time window are assumed to stay constant through 1July); local flows at Rockville, Villanova, and Bethesda are multiplied by factors of 2, 2, and 2.204 respectively (instead of 1); and the starting reservoir elevation is 682 feet rather than 680 feet.
Question I
Which rules are active and when?
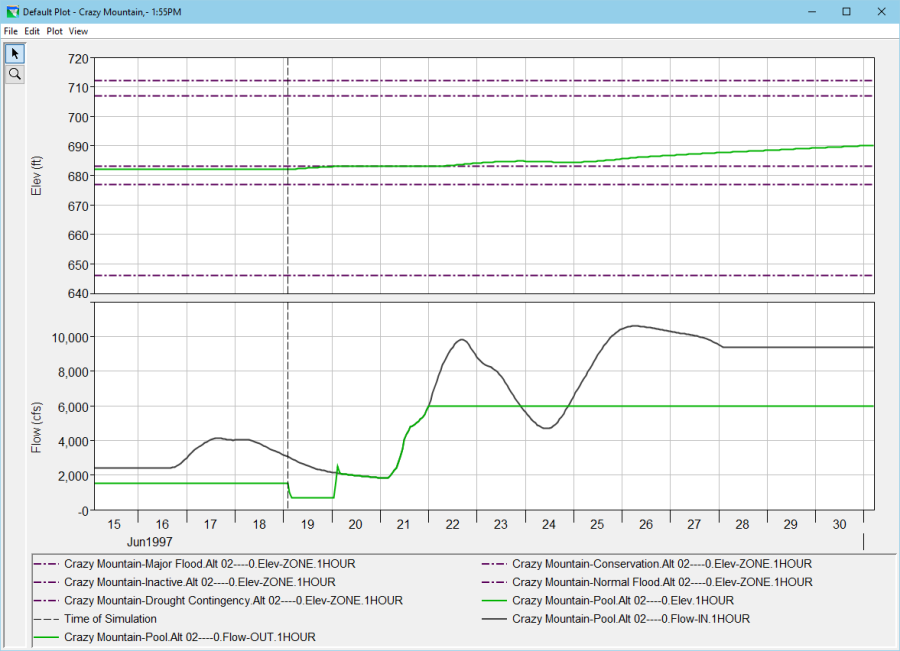
At the start, the reservoir tries to cut back on releases because the pool level is below guide curve. A decreasing ROC rule "slows" the cut back. The release settles at the Min Flow of 700 cfs until the pool reaches guide curve. To hold the pool at guide curve, the reservoir wants to release inflow (20June, 0100). At the transition (20Jun, 0200) an increasing ROC rule holds the release back for 1 timestep causing the pool to overshoot the guide curve by a little bit (20June, 0300). This causes a small spike in the release before it settles back to inflow. Release stays at inflow until it is capped by the Max Flow rule of 6,000 cfs (22June, 0100). This rule and release hold for the rest of the simulation.
Question II
When are the water control plans flow criteria violated? Use the table below to note times when the criteria are violated.
| Location | |||
|---|---|---|---|
Violation | Rockville | Greenfield | River Pointe |
Flow < 2,500 cfs | |||
Flow < 3,500 cfs | |||
Flow > 12,000 cfs | |||
Flow > 40,000 cfs | |||
| Location | |||
|---|---|---|---|
Violation | Rockville | Greenfield | River Pointe |
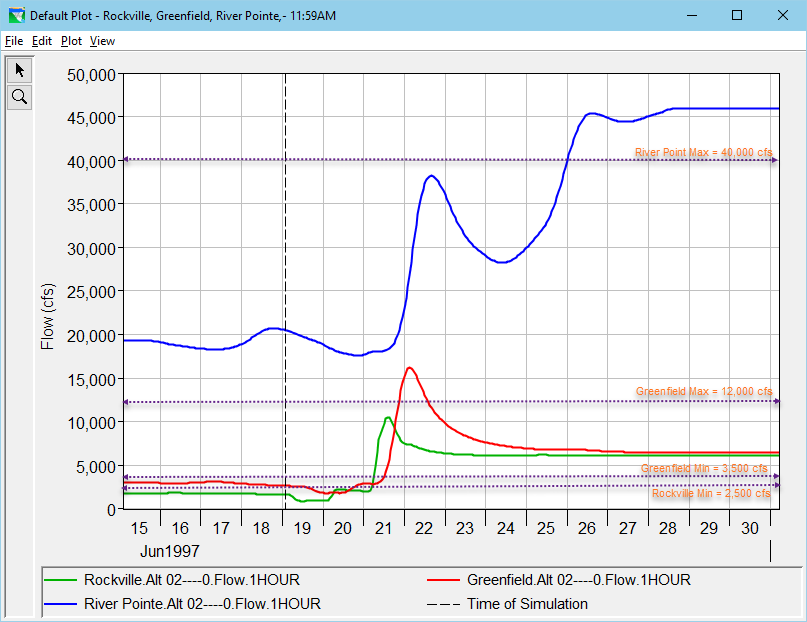
Flow < 2,500 cfs | Start – 21June 0441 | ||
Flow < 3,500 cfs | Start – 21June 1117 | ||
Flow > 12,000 cfs | 21June 2034 – 22June 1446 | ||
Flow > 40,000 cfs | 26June 0513 – end | ||
There are various ways to go about investigating the times which flow criteria were violated. The most effective relies on creating a multi selection default plot which includes Rockville, Greenfield, and River Pointe. Then using narrowing down the curves displayed and visualizing horizontal lines to represent the various flow cutoffs. We then can estimate what locations and dates flow criteria was violated. Having a general idea of when the violations occurred we can look at the tabulated data to get our correct date ranges.
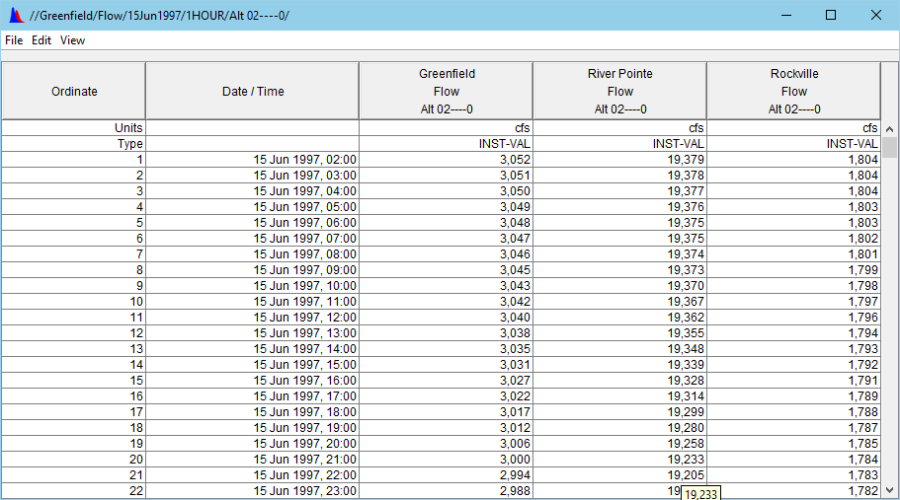
Here is a screenshot of the tabulated data which was used to confirm the date ranges for flow criteria
Task 2. Add Minimum flow limit at Rockville
Open the Reservoir Network Module and the network 01 Standard.
In the Reservoir Editor, duplicate the At-Site Rules operation set and call it DSops-Rock.
In the new operation set, create an operation rule from Crazy Mountain that does not allow flow at Rockville to fall below the minimums as described in Table 3-2 of the Reg. Manual. Once added, this rule should be the lowest priority rule in the zone.
When creating a downstream control rule, once you click OK in the New Rule window, it will not be possible to change the location (control point). The Downstream Control Function Rule Editor looks almost identical to the Release Function rule editor except for two additional fields: Downstream Location (which is shaded gray, thus not able to be changed), and Parameter (which, by default, is set to Flow).
Question III
How did you define the function for this rule (or, what is this rule defined to be a function of)? How many entries are in your function table? What is the interpolation type?
Question IV
To which zone did you add the new rule? Why? To what other zone(s) should you also add the rule?
The new rule is added to all zones, because it is specified at all reservoir elevations above 650 ft. In the Conservation Pool, the rule will force the reservoir to release to meet the minimum flow. Without the rule, Guide Curve operation would tell the reservoir to cut release back to zero to refill the Conservation Pool to the Guide Curve. The rule should also be added to the Normal Flood Pool, because the water control plan specifies that the minimum required release be maintained even if flooding is occurring somewhere in the system.
Task 3. Add Maximum flow limit at River Pointe
- Make a copy of the DSops-Rock operation set and call it DSops-Rock&River.
- Add an operation rule that does not allow flow at River Pointe to exceed the seasonally varying maximums as described in Schedule A of the Reg. Manual. Once added, this rule should be the lowest priority rule in the zone.
Question V
What is the "growing season"? What is this rule a function of? What is the interpolation type?
According to the notes in schedule A, the "growing season" is from May 1 to December 14. The rule is a function of date. Since Schedule A does not mention a linear change, the rule is a step interpolation (i.e., no interpolation) between the two seasons.
Question VI
To which zone did you add the new rule? Why? To what other zone(s) should you also add the rule?
The rule can be placed in all zones. It is most relevant in the Normal Flood Zone, to limit reservoir releases that Guide Curve operation will cause to bring the reservoir back down to the Guide Curve. The rule is needed in the Conservation zone to limit the release the reservoir can make to maintain the guide curve level. The rule is less relevant in the Drought Zone because GC operation causes the reservoir to hold back water, and the Major Flood where it will be overridden by higher priority releases.
Task 4. Add flow limits at Greenfield
- Make a copy of the DSops-Rock&River operation set and call it Water Control Plan.
- Add an operation rule that does not allow flow at Greenfield to exceed the seasonally varying maximums as described in Schedule A of the Reg. Manual.
- Next, add an operation rule that will provide the minimum flows described in Table 3-3 of the Reg. Manual.
- Add the rules so that the minimum flow rules have higher priority than the maximum flow rules and the priorities of the downstream locations are in the following order: Rockville, Greenfield, and River Pointe.
- Close the reservoir editor and save the network.
Question VII
In what ways did these rules differ from those you created in tasks 2 & 3?
These rules for Greenfield are the same as the minimum flow rule entered in task 2 and the maximum flow rule entered in task 3, except the values of the limits differ and the "downstream location" is Greenfield for both.
Question VIII
To which zone did you add the new rule? Why? To what other zone(s) should you also add the rule?
As in tasks 2 and 3, the rules can be entered in all zones, but the minimum flow rule is needed in Normal Flood, Conservation and Drought, and the maximum flow rule is needed in Normal Flood and Conservation.
Task 5. Create an alternative for each new operation set
- Use SaveAs of Alt 02 then change the operation set.
- Name the new alternatives WCP-Rock, WCP-RR, and WCP-RRG and assign each an Operation Set as noted in the table on page 1.
- Verify that the Time Step is hourly and the Flow Computation Method is Instantaneous for each alternative.
Task 6. Add the new alternatives to the WS4 simulation
- Open the simulation module.
- Edit the simulation (right-click on the simulation in the Simulation Control Tree or go to the Simulation menu and select Edit) and add the three new alternatives that you have created.
Task 7. Analyze Rockville Operations
- Set the WCP-Rock alternative active.
- Compute.
- Examine results at the reservoir and the Rockville junction.
- Compare results to Alt 02 (using the At-Site Rules operation set).
Question IX
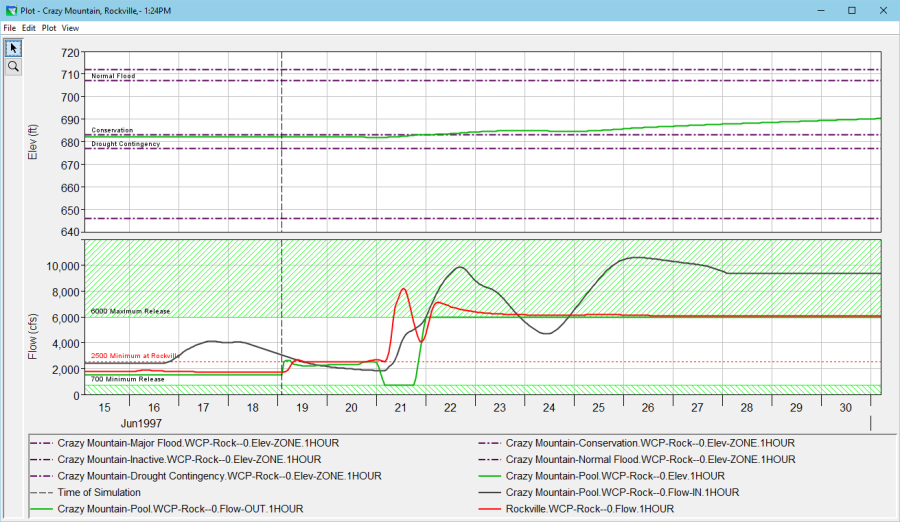
How do reservoir releases for the WCP-Rock differ from Alt-02 (the At-Site Rules operations)? When do they start? Why do they start? When do they end? Why do they end at that time? Do the WCP-Rock results meet the Rockville minimum flow objective? Why or why not?
The WCP-Rock alternative attempts to maintain the minimum flow of 2500 cfs at Rockville, while Alt-02 did not. Extra releases from the dam to maintain the 2500 cfs start immediately, and continue until June 21, when local inflows at Rockville make them unnecessary, allowing the reservoir to cut back to the local 700 cfs minimum flow. Except very early in the simulation, WCP-Rock results meet the minimum flow requirement. Because the reservoir was not releasing enough flow in the lookback period, the increased releases at the start of the simulation take a few hours to get routed to Rockville, so for the first few hours of the simulation window, the flows at Rockville are below the minimum objective of 2500 cfs.
Task 8. Change rule priority
- Give the Rockville minimum flow rule a higher priority in the conservation zone and re-compute the simulation.
If you want to compare simulation results for different rule priorities, make a trial. Once the trial is active, open the reservoir editor and change the priority of a rule by right-clicking on it in the rule tree and selecting one of the "move" options (increase priority, decrease priority, move to top, and move to bottom). Compute the trial and compare its results to the original alternative.
Question X
How does changing the priority change the simulated operations? Why? What changes do you observe if you give the rule other priorities?
Changing the priority does not change the releases. When in the Conservation Pool, the reservoir tries to minimize releases to refill the Conservation Pool. The downstream minimum flow rule places a limit on the amount the release can be minimized. This limit restricts the release regardless of the priority assigned to the rule in the stack. (Remember the rule of thumb?)
Task 9. Analyze the maximum flow limit at River Point
- Set the WCP-RR alternative active. Compute.
Question XI
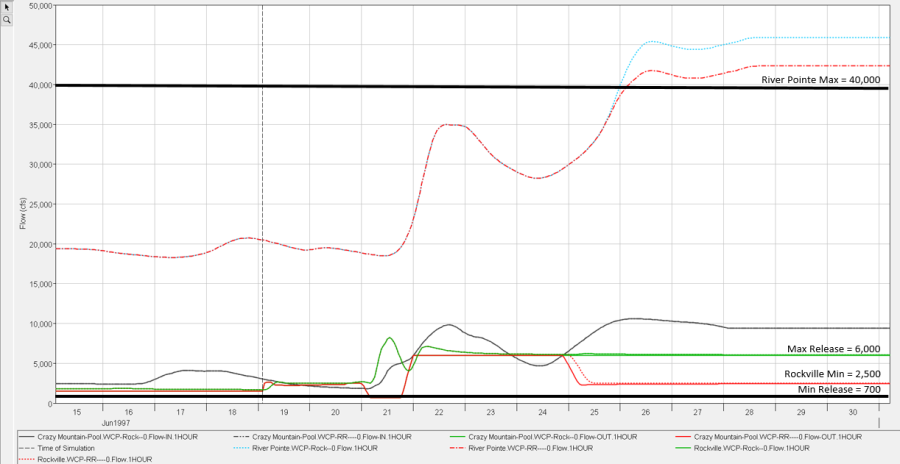
How do reservoir releases now differ from WCP-Rock alternative? When do the differences begin? Why do they start? When do they end? Do the results meet the River Point channel capacity? Why or why not?
Starting June 24, at 2200, the reservoir release decreases from the local maximum flow of 6000 cfs to approximately 2400 cfs to reduce the flow at River Pointe. This change does not completely meet the maximum flow requirement at River Pointe because of the higher priority minimum flow requirement at Rockville. If the reservoir were to release enough to maintain 2500 cfs at Rockville (and 700 cfs below the dam), it would cause the exceedance of the 40,000 cfs maximum at River Point.
Task 10. Change the rule priorities to allow the reservoir to operate for River Pointe.
Hint
HINT, use another trial.
Question XII
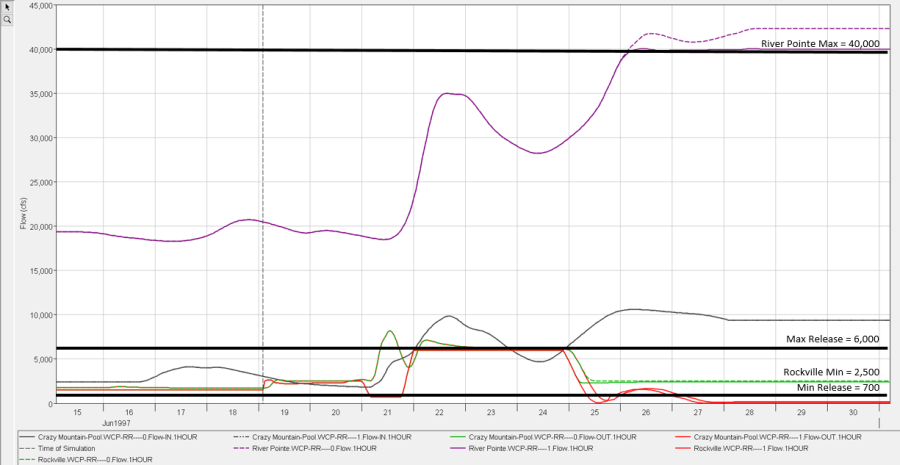
What is the new rule order? How do reservoir releases and downstream flows at River Pointe now differ? Do the results meet the constraint you are trying to model (flow at Rockville must be at least 2500 cfs)? Why or why not?
The new rule order gives the maximum flow at River Pointe a higher priority than both the minimum flow at Rockville and the local minimum flow of 700 cfs. The reservoir release is now reduced to try to maintain River Pointe below 40,000 cfs, violating the minimum required flows at the dam and at Rockville. The River Pointe maximum flow constraint is now met, except for a brief period on June 26 and 28. The misses are less than 50 cfs out of 40,000, about 0.125%.
Question XIII
Which rule priority scenario is preferable?
The question amounts to "should minimum flow requirements for fish or water supply be allowed to worsen flooding?" In the case of fish flows, the fish do not survive if the flow below the reservoir is decreased to zero, so the consequence of breaking the rule is extreme. A slight increase in flooding might be worth avoiding this consequence.
The answer to this question depends on the specifics of the region being modeled. In general, a minimum flow for water supply does not add to flooding as is shown in this workshop (i.e., the 2500 cfs minimum at Rockville), because the flow is diverted and only a portion is returned to the river.
Task 11. Analyze the Flow limits at Greenfield
- Set the WCP-RRG alternative active. Compute.
Question XIV
How do the results now differ from WCP-RR alternative? When do they start? Why do they start? When do they end? Why do they end at that time? Do the results meet the Greenfield flow constraints? Why or why not?
Releases are very similar to the RR alternative, but a little higher during the June 19 – June 20 period and after June 25, to maintain the minimum required flow of 3500 cfs at Greenfield. The maximum flow constraint of 40,000 cfs at River Point is exceeded by about 630 cfs further than the RR alternative due to the increased min flow releases. The maximum flow constraint of 12,000 cfs at Greenfield was attempted but limited by the local minimum flow of 700 cfs (from June 21 at 2200 to June 22 at 0600), even without the maximum flow rule at Greenfield, so high flows there were not altered.
Question XV
Can you change rule priority for the Max Flow-Greenfield rule to show an operational influence? Do the results meet the objective you are trying to model? Why or why not?
By giving the maximum flow rules (Greenfield and River Point) a higher priority than the minimum flow rules (dam, Rockville and Greenfield), the maximum flow of 40,000 at River Point can be maintained. The maximum flow of 12,000 cfs at Greenfield is still not exceeded, but it is as close as possible, as the reservoir release was decreased to zero and the limit was exceeded only by local inflows below the reservoir.
Question XVI
Which scenario of rule priorities is preferable?
Again, the question amounts to "should minimum flow requirements for fish or water supply be allowed to worsen flooding?" The answer is the same as earlier. In the case of fish flows, the fish do not survive if the flow below the reservoir is decreased to zero, and so the consequence of breaking the rule is extreme. A slight increase in flooding might be worth avoiding this consequence. The answer to this question depends on the specifics of the region being modeled.
Task 12. Analyze the Influence of routing on downstream operations
- Create a new trial of the WCP-RRG alternative.
- Right click on the downstream-most reach, VENT Oak River to River Pointe, and select Edit Reach Properties.
- Modify both the Muskingum K and Subreaches from 1 to 8.
- Apply the changes, compute the trial, and compare the results to the original alternative.
Question XVII
What is the difference at River Pointe? Why? How/why is this an improvement?
The new routing values give the flows at River Pointe a smoother curve while making them slightly less flashy.
Question XVIII
How does the release decision at Crazy Mountain differ?
The release volumes are the same, but the Max Flow-River Pointe rule takes effect 3 hours earlier in the trial than it does in the original alternative in order to account for the longer routing time.
In reality, the new values are actually closer to the true values for the routing reach.
Task 13. Analyze the Influence of a diversion on downstream operations
- Return to the Network Module.
- Use Network, SaveAs to Make a copy of the 01 Standard network and call it WithLoopy. Verify that the WithLoopy network is the current network.
- Select the diversion tool and draw in the Loopy diversion, which removes flow from Rockville and returns it to the network at Bethesda.
- Enter the diversion function and routing as described in Appendix B of the Reg. Manual.
- Modify the Muskingum Routing values of VENT Oak River to River Pointe to those of the trial in the previous exercise.
- Save the network.
Create a NEW alternative
- Using the WithLoopy network, create a new alternative. Name it WCP-Loopy.
- Select the Water Control Plan operation set.
- Set the Time Step to 1 Hour and the Flow Computation Method to Instantaneous.
- Set the initial conditions and time-series selections to the same as those for the WCP-RRG alternative.
- The initial condition of the diversion should be set to 0.
To copy the time series selection from one alternative to another, select the entire set of rows in the original alternative, then press ctrl-C or select copy from the right-click menu. Then select the first (grey, not white) cell of the time series table for the new alternative. Use Ctrl-V (not right-click, paste) to paste the copied cells into the new table.
- Switch back to the simulation module. Edit the simulation and add the WithLoopy alternative. Compute. Compare the results to those of WCP-RRG.
Question XIX
What effect does the diversion have on the reservoir and its operations? Were any of the three control points affected? If so, which ones and in what way?
Releases from the reservoir are about 340 cfs higher with the diversion than without, except where release is limited by the 6000 cfs local maximum flow rule. During that period, release from the reservoir is the same, and flows at Rockville and Greenfield are 1000 cfs lower due to the 1000 cfs diversion at that time. Below Bethesda (including River Point), the difference in flow is the 340 cfs difference seen at the reservoir.