Download PDF
Download page New Features.
New Features
- System Types. The most significant change in version 3.0 is introduction of “System Types”. System types control units used during formulation of water management alternatives. Previous versions of RPT used flow in cubic feet per second (English units system) or cubic meters per second (metric units system). With system types, users can specify which data and units are used. RPT includes default system types for “Flow” and “Elevation”, but users can define other system types for considerations like water temperature, power generation, etc. System types are comprised of a name, English and metric units, and units conversions (Figure 1).
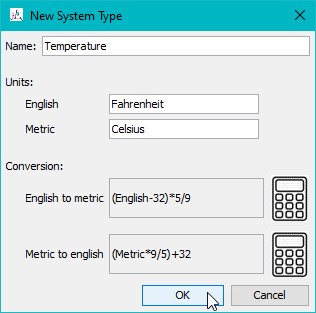
Figure 1. Adding a new water “Temperature” system type.
Inclusion of system types was a fundamental enhancement to the software and led to a cascade of related changes, including:
Plot axis titles and units and interface labels. Titles and labels that had been just “flow” were changed to be sensitive to active system type name (e.g., Figure 1, “Temperature”). Units shown in RPT plots, interfaces, and reports were made sensitive to system type units and the unit system setting (English or metric).
Menu options and interface labels. Menus and interface labels were switched from “Flow” to “Components” to be more generic and inclusive of different system types.
Working with system types. Menu options were added that allow users to create new, edit, switch, rename, and delete system types (Figure 2). Deleting a system type is limited to only the system types that are not currently associated with any systems in the RPT application.
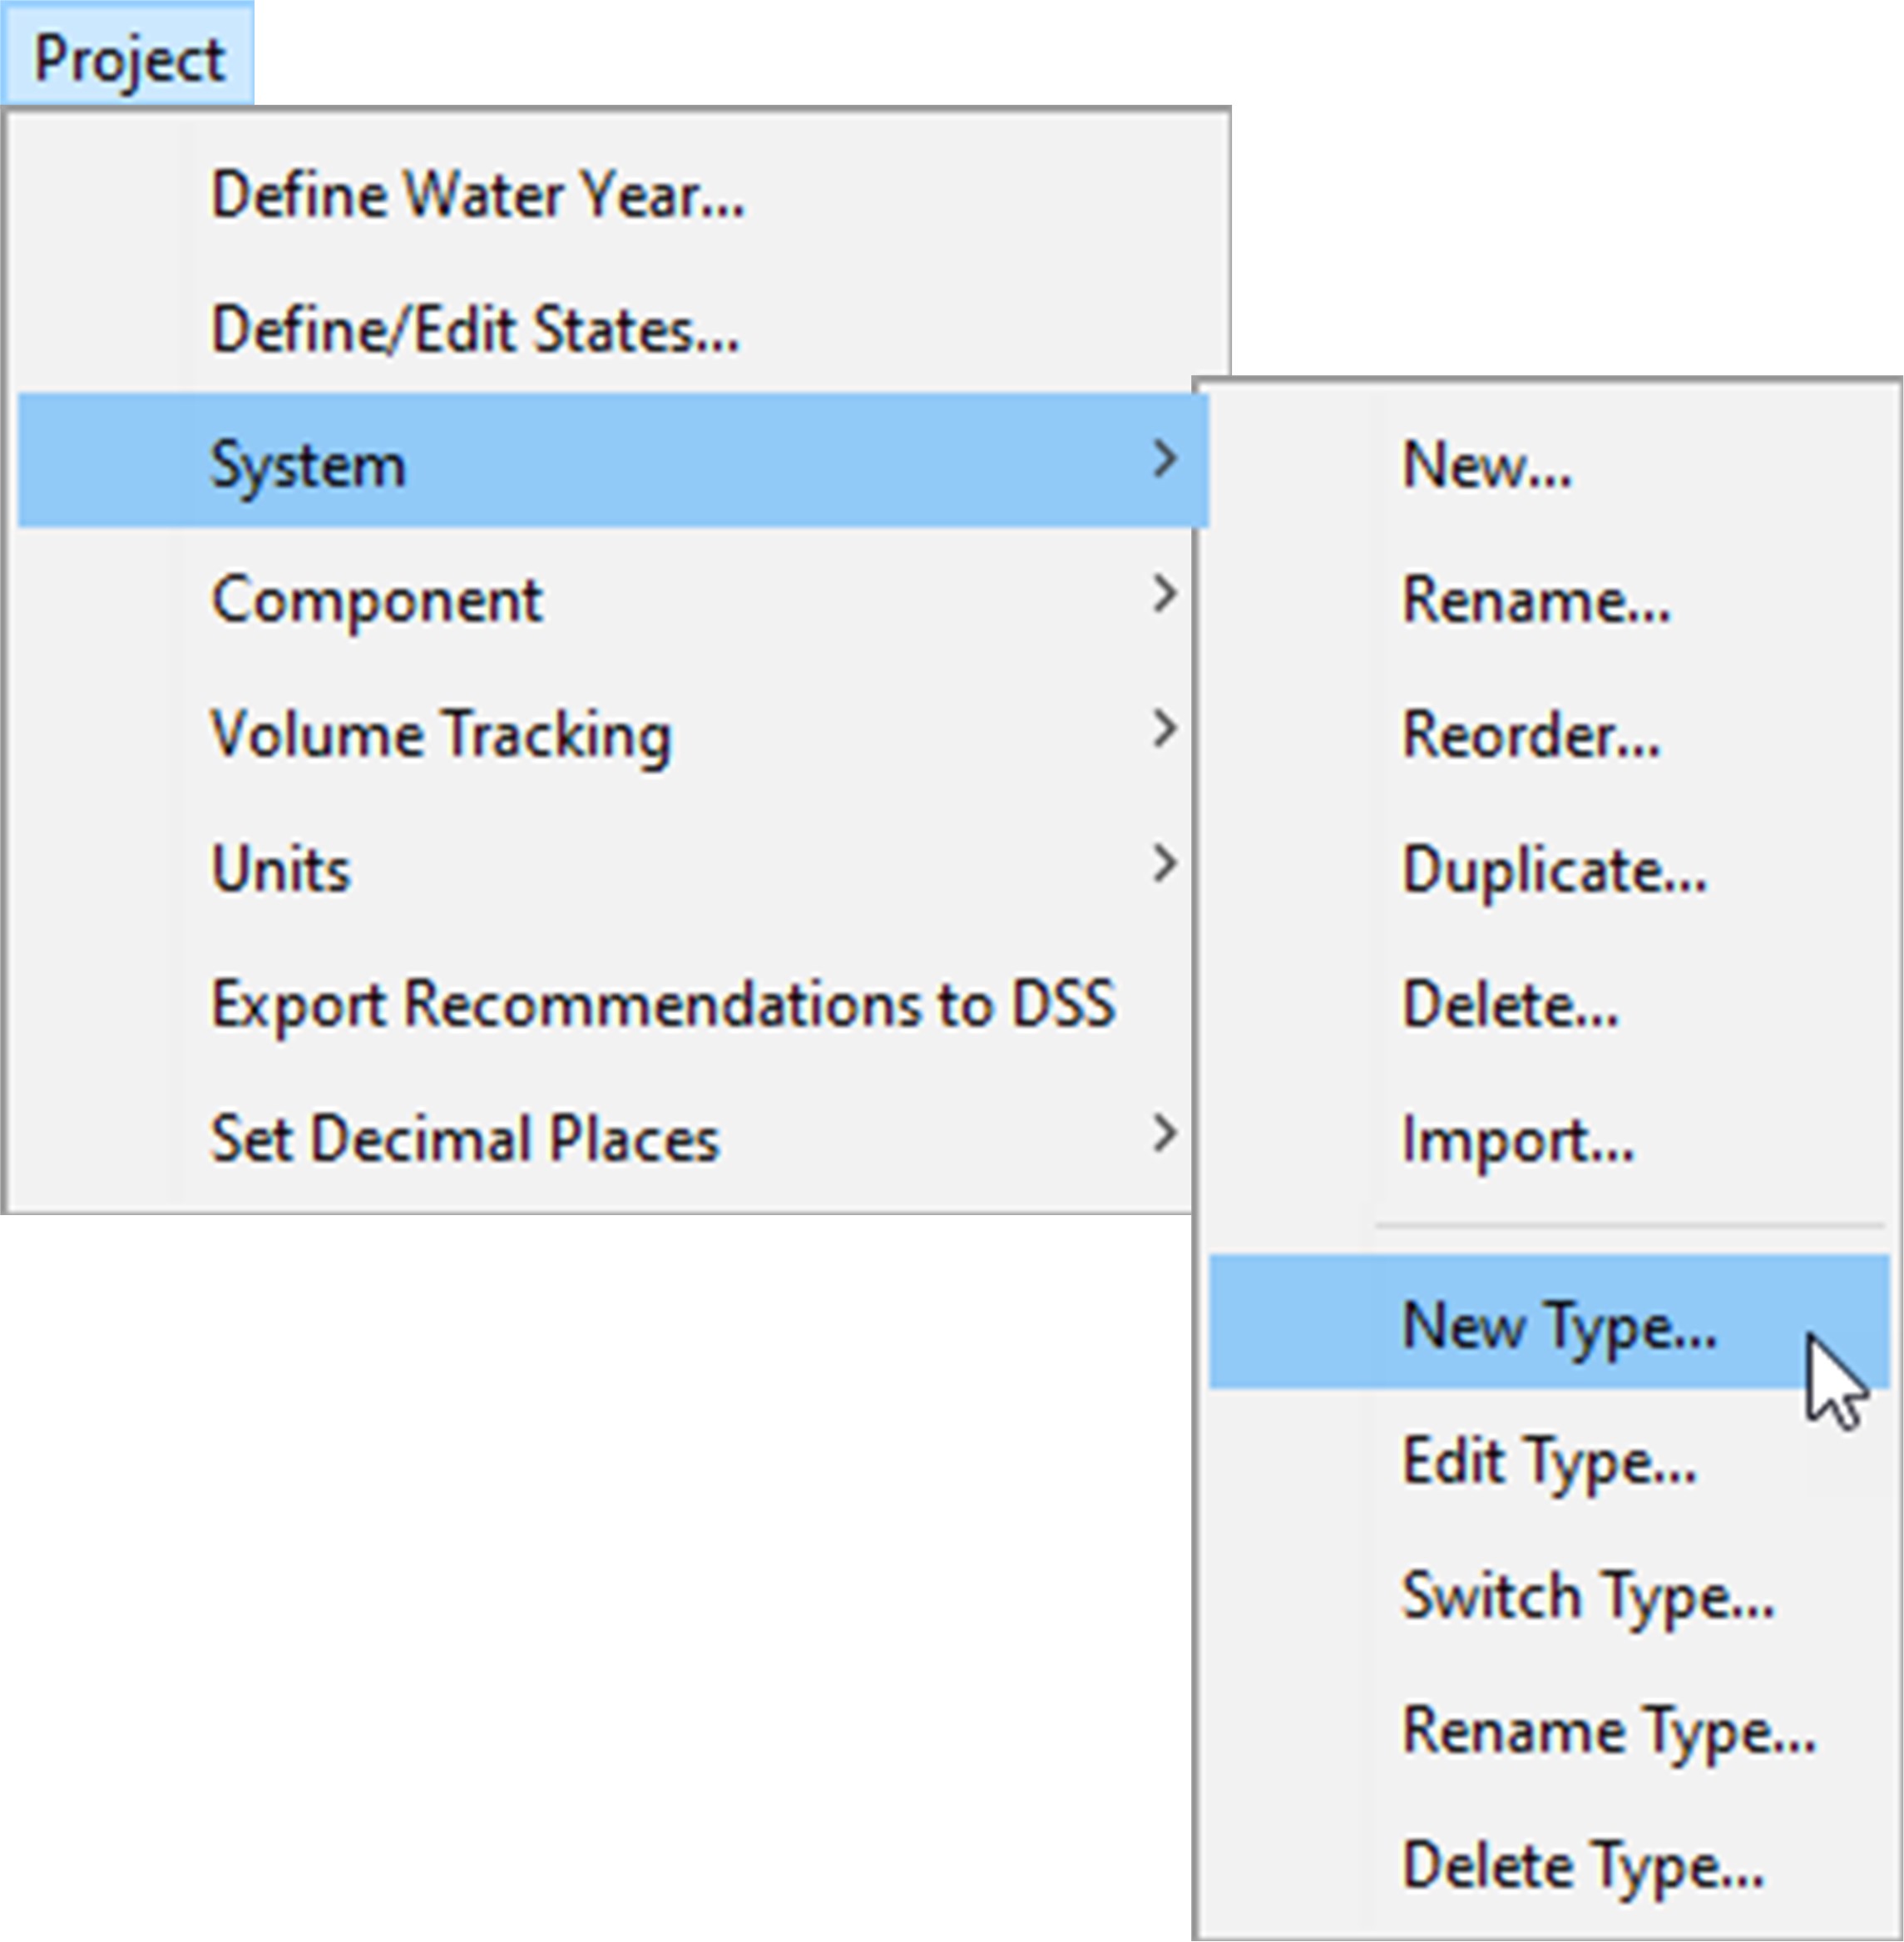
Figure 2. Menu options related to system type management.
Volume tracking. Volume tracking was made functional only for the “Flow” system type because it uses the required units of volume per time. Volume tracking was disabled for all other system types, including “Elevation”, to preempt any unit incompatibilities.
Time series management. With new system types, management of time series became more complex. In RPT, imported data are associated with individual systems (and corresponding system types). Previous versions of RPT displayed all imported time series regardless of units for the selected system. RPT 3.0 displays data in the main plot when data units match the active system type units or an alias thereof (a list of aliases is included with the HEC-RPT software). For example, if three time series were imported to a system that used the “Flow” system type (English units of “cfs” and metric units of “cms”) and the three time series had units of “cfs”, “m3/s”, and “feet”, then the first time series would display because its units match the English units of the current system type, the second time series would display because “m3/sec” is an alias for the metric system type unit of “cms”, and the third time series would not display because units of “feet” is not compatible with “cfs” or “cms”. However, if the system type were then changed from “Flow” to “Elevation”, the first two time series would not be displayed and the third would because “feet” is also the English units of the “Elevation” system type.
Units conversions. With new system types, units conversions became more complex. Previous versions converted values from English to metric based on equations for converting flow rates from cfs to cms, and vice versa. RPT 3.0 stores and applies unit conversation equations for all defined system types, including “Flow” and “Elevation”.
Predefined plots. RPT offers several predefined plot options. All were modified as needed to align with system types. For example, “Predefined Plots – One State for all Systems” (Figure 3) was made system type-specific to preempt display of recommendations formulated in different units (e.g., avoid trying to display a single plot of flow recommendations and elevation recommendations).

Figure 3. Adjusting predefined plots to accommodate system types.
- Predefined Plots - Choose Systems and States. A new predefined plot option was added called “Choose Systems and States”. It is an adaptation of the first two predefined plot options, “All States for one System” and “One State for all Systems”. The new option simply allows users to select which system-state pairings they would like to plot together for visualization and comparison purposes. When the user selects this plot option, RPT opens an interface that allows the user to select the desired system-state pairs (Figure 4). Please note that RPT filters the available pairs per system type such that only the systems that share a system type with the active system are listed. After selection is complete, RPT generates the requested plot.
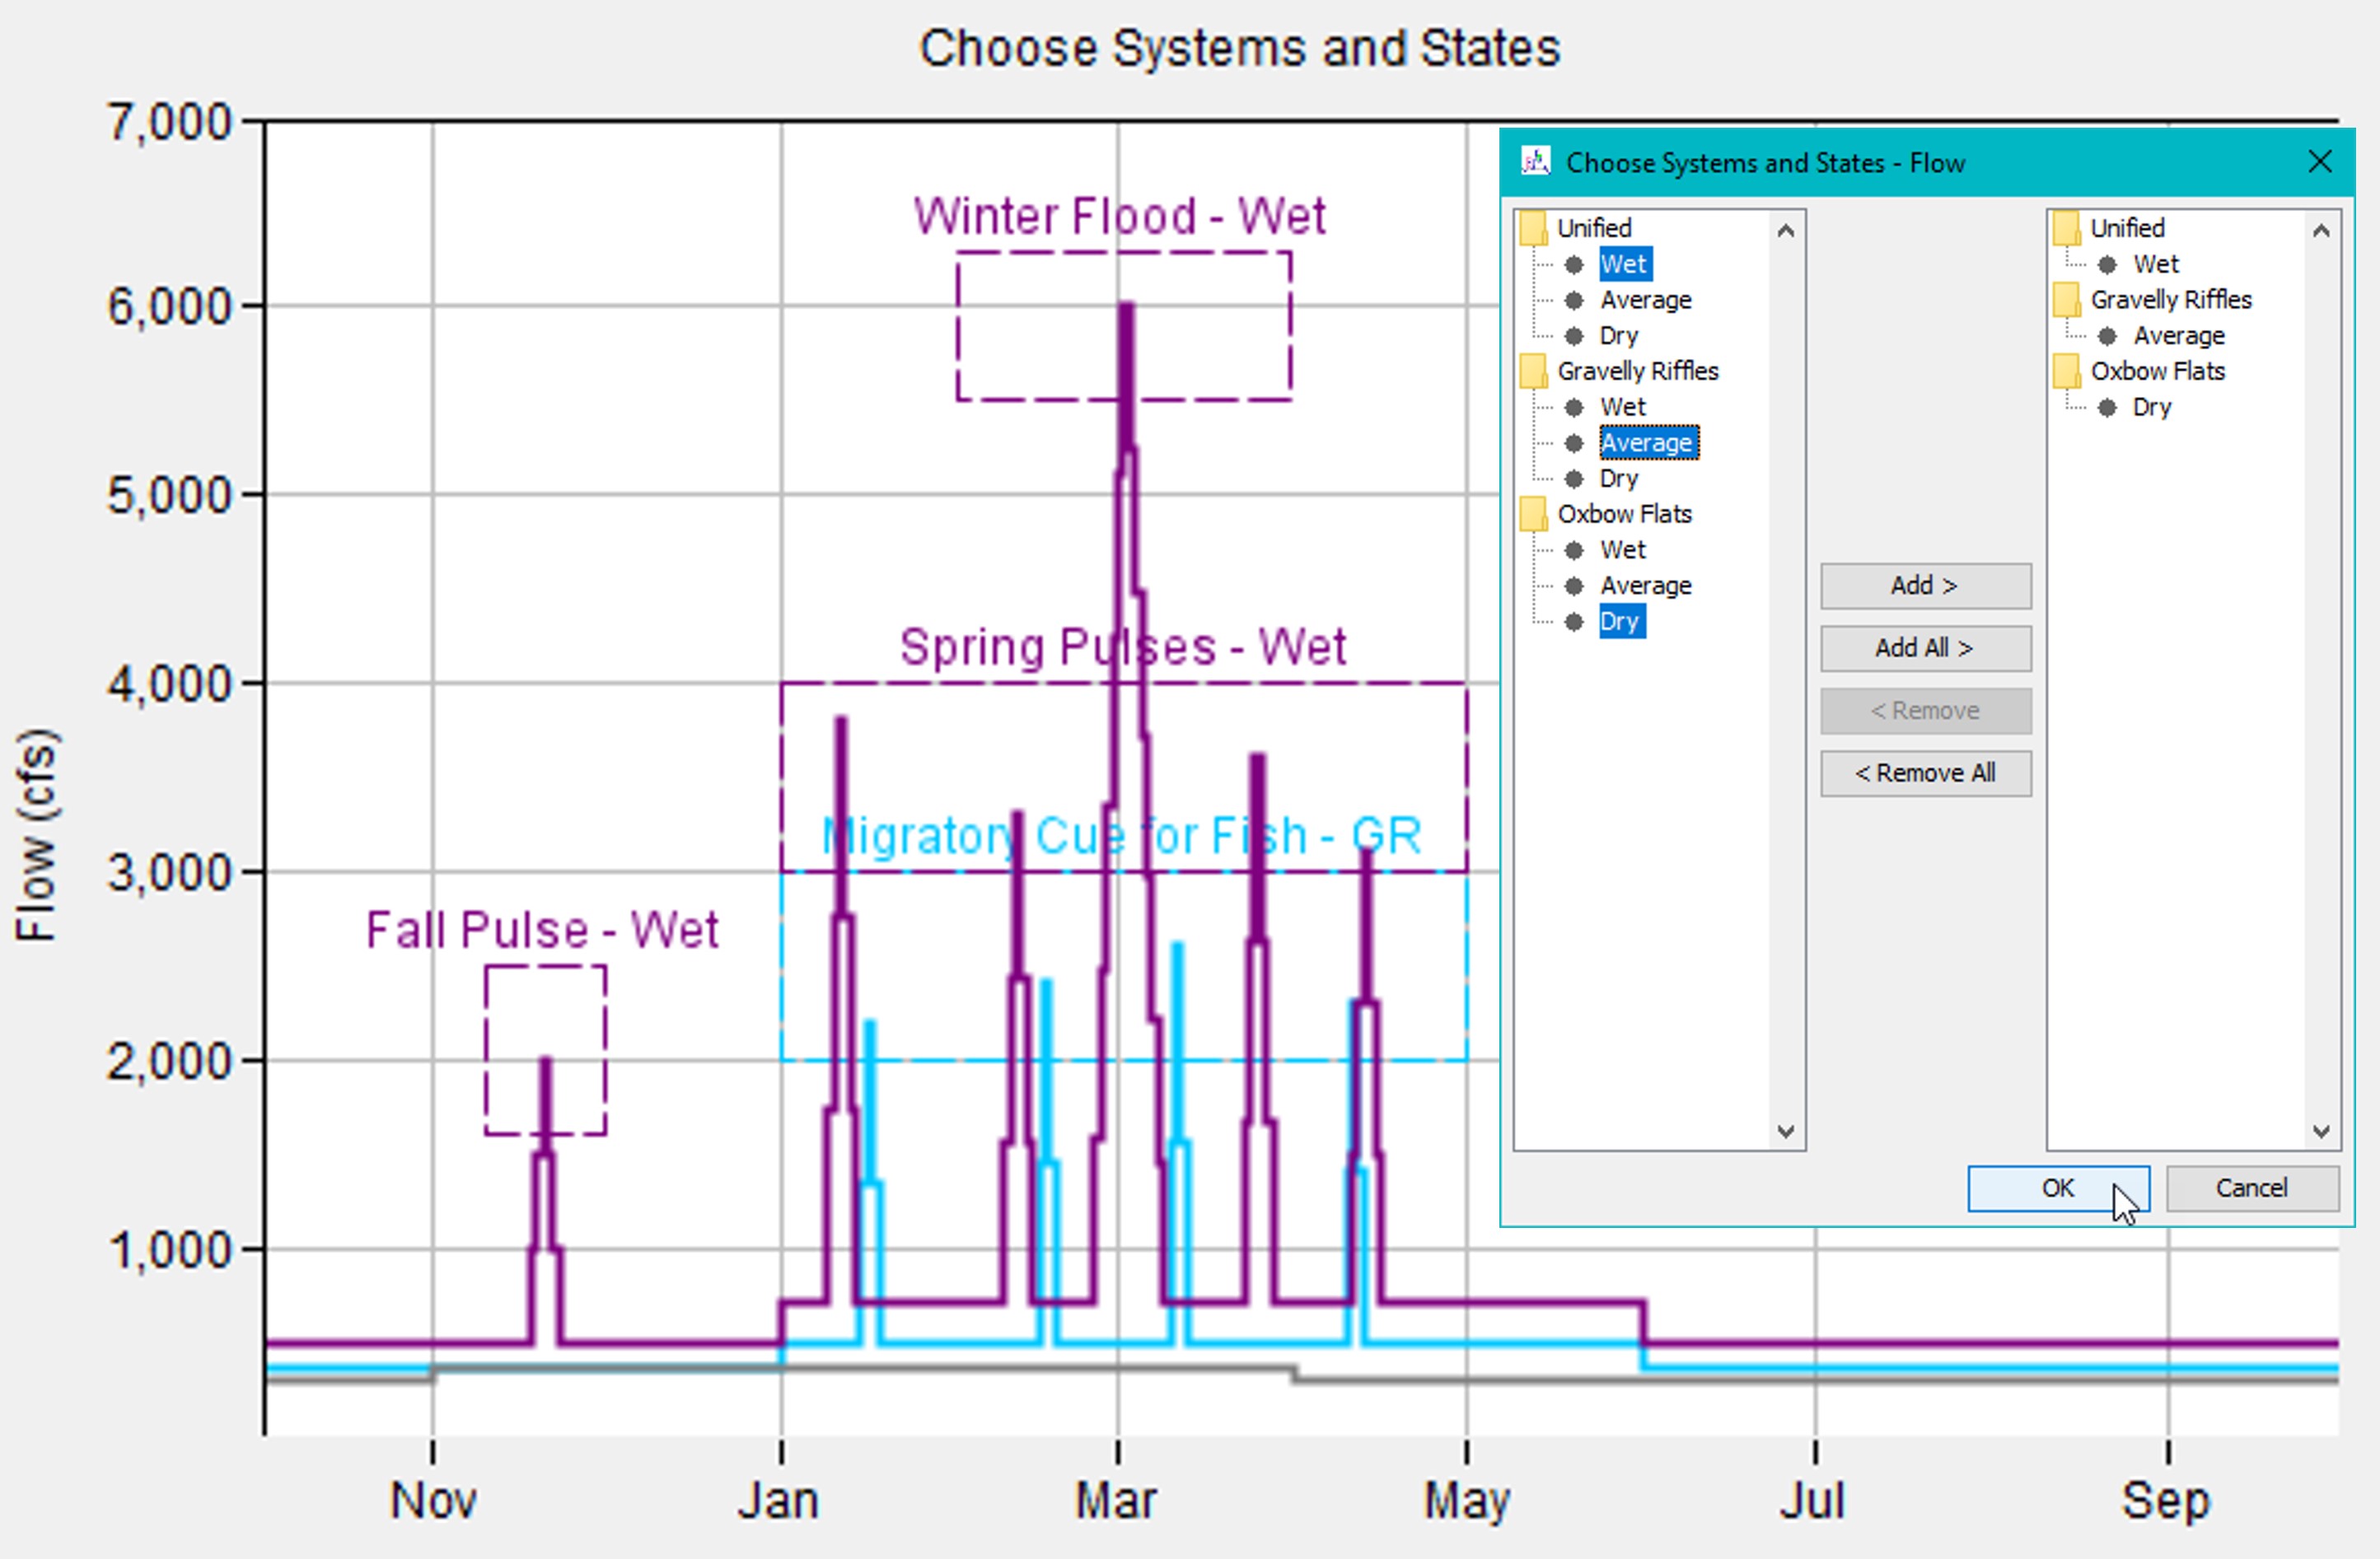
Figure 4. Adjusting predefined plots to accommodate system types.
- System Reorder. A new menu option and interface were added that allows users to reorder the systems of RPT applications, which is useful for visual and organizational purposes (Figure 5).

Figure 5. Reordering systems.
- Data List - Reorder. Right-click menu options were added that allows users to reorder the data list of RPT applications. The data list order controls plot order, which makes this a useful enhancement for visualization purposes (Figure 6).
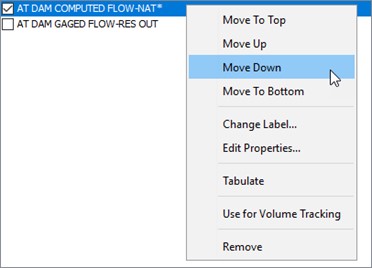
Figure 6. Reordering time series.
- Data List - Change Label. The default naming convention for the data list is based on the b-, f-, and c-parts of the imported time series. RPT 3.0 allows users to relabel those time series (Figure 7).
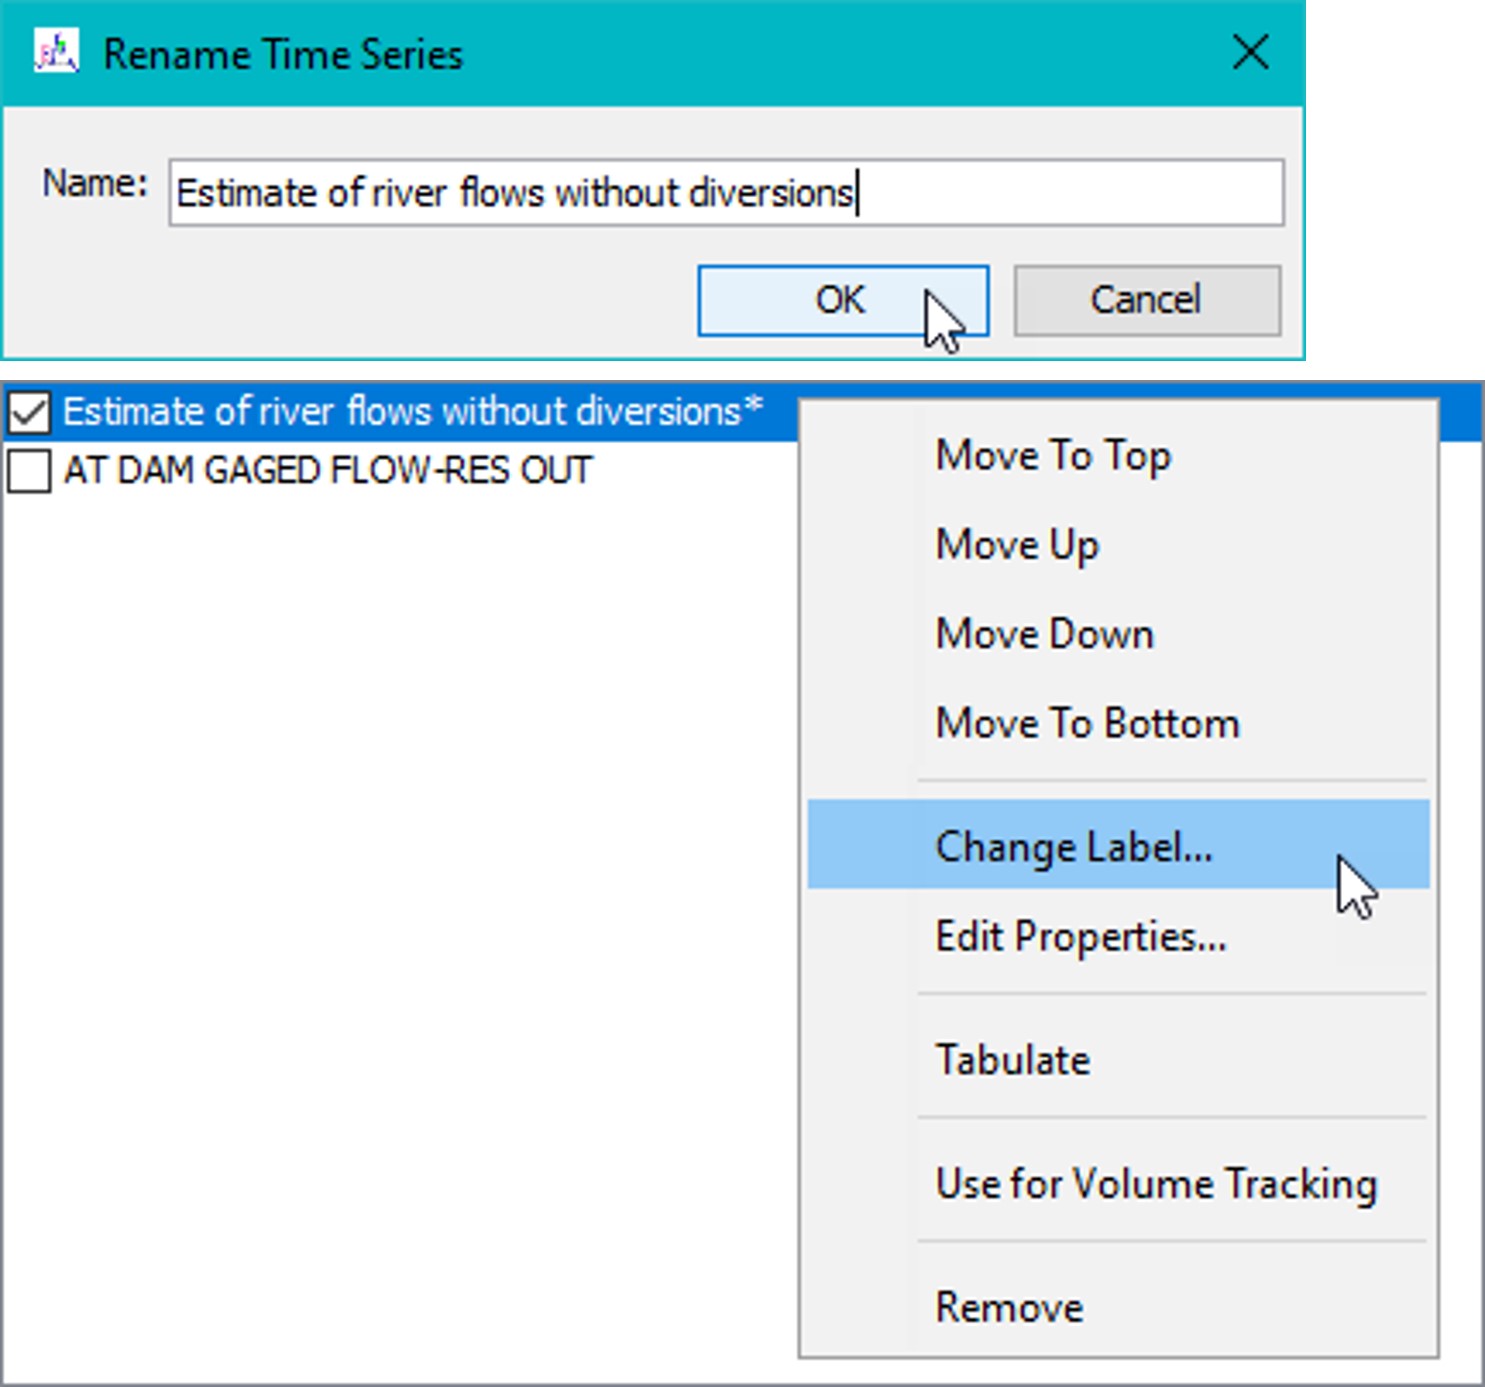
Figure 7. Relabeling time series.