Download PDF
Download page Modeling Surface Erosion and Sediment Transport in HEC-HMS.
Modeling Surface Erosion and Sediment Transport in HEC-HMS
Software Version
HEC-HMS version 4.13 beta 1 was used to create this example. You can open the example project with HEC-HMS 4.13 or a newer version. HEC-DSSVUE is also required for this tutorial and can be downloaded here: HEC-DSSVue Downloads (army.mil).
Project Files
Download the Initial Project Files here: UpperNorthBosque_Initial.zip
Introduction
Sediment from the land surface is concerned as a most common pollutant because sediment transports nutrient and toxic materials from urban, agricultural and forested lands. The Upper North Bosque River is primarily located within Erath County, Texas. It serves as a critical resource for the surrounding region. Originating in central Erath County northwest of Stephenville, it flows southeast through towns like Hico, Meridian, Clifton, and Valley Mills before entering Waco Lake in McLennan County. The North Bosque River is an essential surface water supplies for cities such as Waco, Clifton, and soon, Meridian, providing drinking water and supporting agricultural activities and recreational fishing and swimming for local residents. Two subbasins from the North Bosque watershed model have been extracted to demonstrate how to model sediment transport and erosion within subbasins, routing reaches and reservoirs. The subbasin parameters have already been calibrated for flows.
Objectives
The first objective is to develop the surface erosion and sediment transport model based on the given information from the existing HMS model calibrated just for flow. The second objective is to calibrate the two-year accumulated sediment amount using observed sediment data.
In this workshop you will develop the surface erosion and sediment transport model:
- Activate the erosion and sediment transport features in the basin model.
- Select proper sediment methods and enter proper parameters that will be applied to all elements within the basin model.
- Select the surface erosion method for each subbasin element.
- Determine the parameters for the Modified USLE erosion method at two subbasin elements.
- Select a channel sediment transport method for each reach element.
- Determine the parameters for the volume ratio sediment method editor at a reach element.
- Select a reservoir sediment method for the reservoir element.
- View erosion and sediment results.
- Calibrate your surface erosion and sediment transport model by changing the major select parameters based on the given observed sediment load data.
Task 1: Set up the Subbasins for Sediment Transport
- Open the UpperNorthBosquer.hms HMS project and click on the North_Bosque Calibration basin model. In the Basin Model Editor Panel, select Yes from the Sediment Transport dropdown to turn on basin sediment transport.
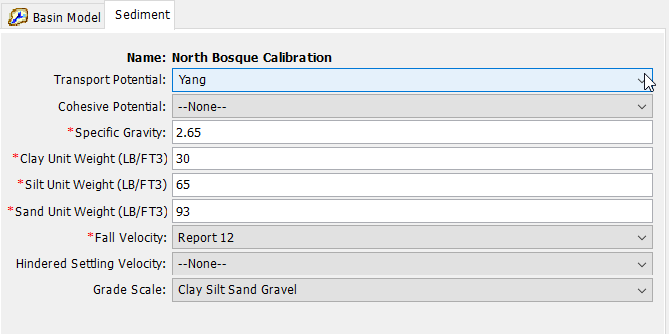
- Select the Sediment tab for the basin model and select the Yang’s Method as the Transport Potential Method and the Report 12 method as the Fall Velocity Method.
- Select the SF020 and SCS8 subbasins and set the Erosion Method to Modified USLE from the dropdown on the subbasin editor panel. A small window will appear as shown in the figure below. Select Yes to continue. There should now be an Erosion tab on the subbasin editor panel.
Fill out the Erosion tab for the two subbasins (SF020 and SCS8) using measured information as initial values shown in the subbasin information table below.
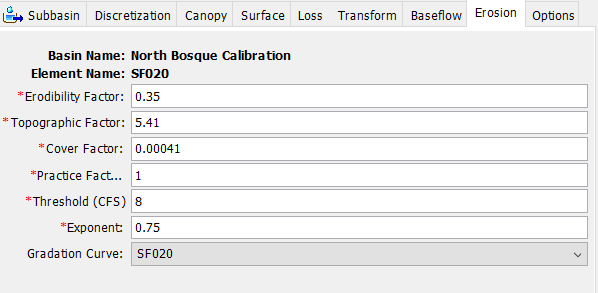
5. Create a gradation curve for each subbasin by selecting Component > Paired Data Manager and selecting Diameter-Percentage Functions as the Data Type. Select New... and name the new paired data component SF020.
6. Repeat step 5 and name a second paired data component SCS8. Input the gradation curves shown in the table below in the corresponding table in the Component Editor by accessing Paired Data > Diameter-Percentage Functions.

Calculated and measured information for the subbasin elements
| SF020 | SCS8 | ||
| Erodibility Factor | 0.35 | Erodibility Factor | 0.41 |
| Topographic Factor | 5.41 | Topographic Factor | 1.48 |
| Cover Factor | 0.00041 | Cover Factor | 0.0029 |
| Practice Factor | 1 | Practice Factor | 1 |
| Threshold | 8 | Threshold | 1 |
| Exponent | 0.75 | Exponent | 0.75 |
| Gradation Curve | Gradation Curve | ||
| Diameter (MM) | Percent Finer (%) | Diameter (MM) | Percent Finer (%) |
| 0.0024 | 0 | 0.0024 | 0 |
| 0.004 | 24 | 0.004 | 19.22 |
| 0.0625 | 84 | 0.0625 | 67.46 |
| 2 | 100 | 2 | 100 |
Task 2: Set up the Routing Reach for Sediment Transport
- Select the SFRIVER10 reach. Select the volume ratio method as an initial sediment method in the editor panel.
- Fill out the Sediment tab using table of reach information presented below.

3. Create a gradation curve for the reach by selecting Component > Paired Data Manager and selecting Diameter-Percentage Functions as the Data Type. Select New... and name the new paired data component B020 Reach.
4. Input the gradation curve shown below in the table in the Component Editor by accessing Paired Data > Diameter-Percentage Functions.
5. Set the Initial Grad Curve to the B020 Reach on the Sediment tab of SFRIVER10 reach.
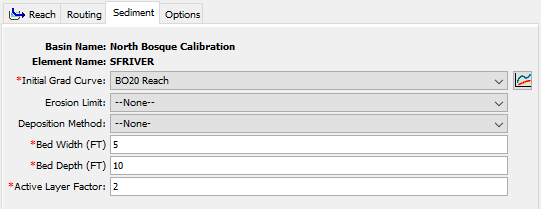
Calculated and measured information for the reach element
| BO20 Reach | |
| Erosion Limit | None |
| Deposition Method | None |
| Bed Width (FT) | 5 |
| Bed Depth (FT) | 10 |
| Active Bed Factor | 2 |
| Channel Bed Gradation Curve (BO20 Reach) | |
| Diameter (MM) | Percent Finer (%) |
| 0.0001 | 0 |
| 0.002 | 6 |
| 0.05 | 8 |
| 2 | 35 |
| 64 | 100 |
Task 3: Configure Sediment Method in Reservoir Element
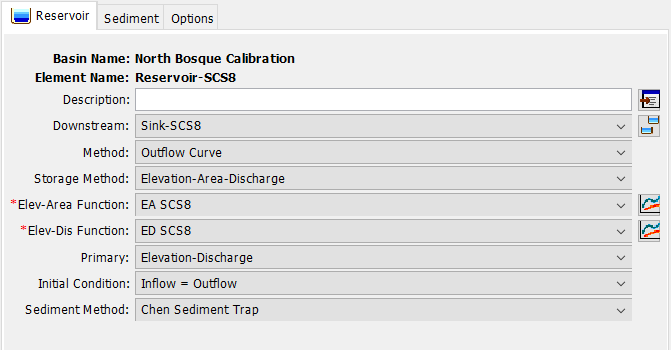
Select the Reservoir-SCS8 and select the Chen Sediment Trap as your Sediment Method in the reservoir element. Keep all other fields as they are. Your component editor should look like the figure below.
Task 4: Run the Simulation
Run using the existing simulation run (RUN 95-96) with your initial values and check your sediment yield results.
- Check your results by opening the output DSS file (RUN95_96.dss) using the HEC-DSSVue. The location of the output file can be found on the Compute tab under Output DSS File textbox.
- Open the RUN95_96.dss file
- Select SEDIMENT LOAD-OUT for C part.
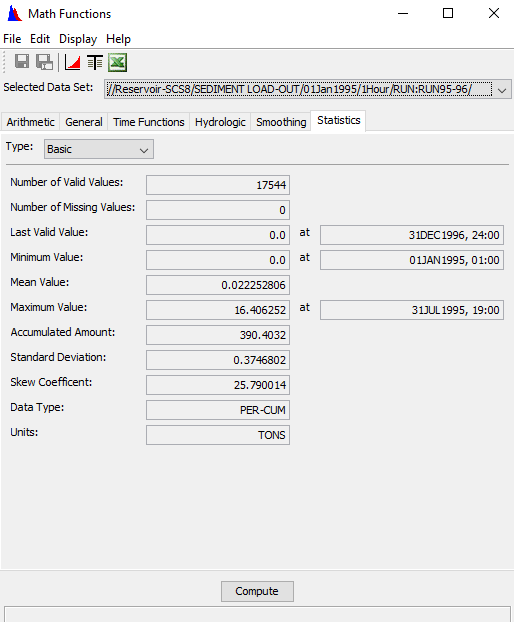
- Check the accumulated sediment yield amounts for J21 and RESERVOIR-SCS8 using the Tools>Math Functions >Statistics option.
- Fill out your initial results (accumulated sediment yield amounts for J21 and RESERVOIR-SCS8) in the calibration results table below.

Task 5: Calibrate the Model to Accumulated Sediment Volume
Make parameter adjustments to better match observed sediment yield data.
Observed sediment yield data for 1995-1996
| Reservoir Sediment In (TONNES) | Reservoir Sediment Out (TONNES) | ||
| Period | 01 Jan 1995 - 31 Dec 1996 | Period | 01 Jan 1995 - 31 Dec 1996 |
| Mean Value | 1.35 | Mean Value | 0.31 |
| Maximum Value | 363.03 | Maximum Value | 61.24 |
| Accumulated Amount | 988.03 | Accumulated Amount | 225.67 |
| Standard Deviation | 15.00 | Standard Deviation | 2.83 |
Calibrate your model manually using observed 2-yr accumulated sediment data. Decide on a few major parameter changes that will help improve the fit between computed and observed sediment load. Repeat this process several times in an attempt to match the simulated and observed values.
Calibration Results Table
PARAMETER | Initial | 1st Trial | 2nd Trial | 3rd Trial | 4th Trial | Final |
Subbasin Parameter | ||||||
Cover Factor (C) for SF020 | 0.00041 | |||||
Cover Factor (C) for SCS8 | 0.0029 | |||||
Reach Parameter (SFRIVER10) | ||||||
Transport Function | Yang | |||||
Active Bed Factor | 2 | |||||
Accumulated Reservoir Sediment Amount | ||||||
J21 (Accumulated Sediment Amount, TONS) | 1260 | |||||
Reservoir-SCS8 (Accumulated Sediment Amount, TONS) | 385 | |||||
Answers will vary.
PARAMETER | Initial | Final |
Subbasin Parameter | ||
Cover Factor (C) for SF020 | 0.00041 | 0.00025 |
Cover Factor (C) for SCS8 | 0.0029 | 0.0015 |
Reach Parameter (SFRIVER10) | ||
Transport Function | Yang | Yang |
Active Bed Factor | 2 | 1 |
Accumulated Reservoir Sediment Amount | ||
J21 (Accumulated Sediment Amount, TONS) | 1260 | 1090 |
Reservoir-SCS8 (Accumulated Sediment Amount, TONS) | 385 | 265 |
Project Files