Download PDF
Download page Example 5. Crest Stage Gage Censored Data – Bear Creek at Ottumwa, IA.
Example 5. Crest Stage Gage Censored Data – Bear Creek at Ottumwa, IA
Example 5 illustrates the computation of a peak flow frequency curve using EMA and Bulletin 17C procedures with an annual maximum series comprised of censored data with variable perception thresholds due to the presence of a crest stage gage. A crest stage gage is a simple, reliable device used to obtain the elevation of the flood peak of a stream. Most commonly, a crest stage gage consists of a vertical metal pipe containing a wood or aluminum staff held in a fixed position with relation to a datum reference. At the bottom of the pipe is a perforated cap containing regranulated cork. When the water in the stream reaches and exceeds the height of the bottom cap (commonly referred to as the gage base), water is able to enter the pipe. As the water rises up the pipe, the cork floats on the water surface and as the water reaches its peak and starts to recede, the cork adheres to the staff thereby retaining the crest stage of the flood (England, et al., 2018). As a result, crest stage gages provide a censored record of peak flows, as no annual peak flow that results in a flood stage below the bottom cap of the pipe will be recorded.
For this example, USGS gage 05489490 Bear Creek at Ottumwa, IA is used. This gage is a crest stage gage and has a drainage area of 22.9 square miles. It is located in southeast Iowa in the Southern Iowa Drift Plain land-form region which is characterized by rolling hills and deeply carved stream channels (Prior, 1991). The stream banks and channel bed are comprised of sand, silt, and clay materials that are prone to shifting from hydrologic events. The Bear Creek at Ottumwa, IA stream gage has an annual peak record consisting of 50 annual peaks. The historical record for this gage spans from 1965 – 2014. The annual maximum series is plotted in Figure 1 and tabulated in Table 1.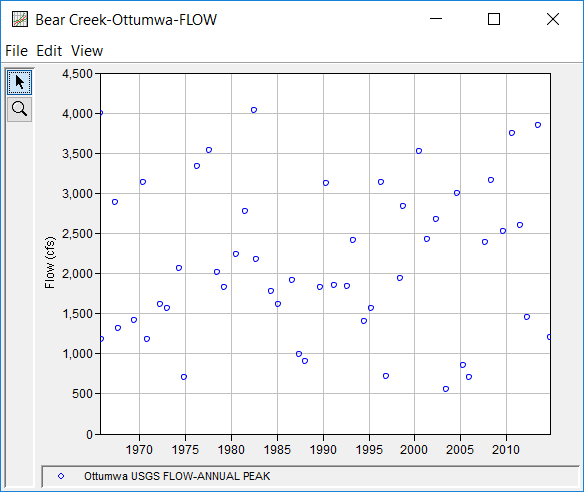
Table 1. Bear Creek at Ottumwa, IA Annual Peak Flow Record.
Date | Flow (cfs) |
|---|---|
21 Sep 1965 | 4000 |
30 Nov 1965 | 1180 |
09 Jun 1967 | 2880 |
15 Oct 1967 | 1310 |
05 Jul 1969 | 1420 |
24 Jun 1970 | 3130 |
30 Nov 1970 | 1180 |
08 May 1972 | 1620 |
19 Jan 1973 | 1570 |
19 May 1974 | 2060 |
30 Nov 1974 | 705 |
24 Apr 1976 | 3340 |
07 Aug 1977 | 3530 |
21 Jul 1978 | 2010 |
29 Mar 1979 | 1830 |
17 Aug 1980 | 2240 |
04 Jul 1981 | 2770 |
03 Jul 1982 | 4030 |
08 Oct 1982 | 2180 |
08 Jun 1984 | 1780 |
04 Mar 1985 | 1610 |
19 Sep 1986 | 1910 |
31 May 1987 | 990 |
20 Feb 1988 | 899* |
09 Sep 1989 | 1820 |
25 May 1990 | 3120 |
18 Apr 1991 | 1850 |
15 Sep 1992 | 1840 |
07 May 1993 | 2410 |
23 Jun 1994 | 1400 |
11 Apr 1995 | 1560 |
28 May 1996 | 3130 |
30 Nov 1996 | 714 |
18 Jun 1998 | 1940 |
05 Oct 1998 | 2840 |
23 Jun 2000 | 3520 |
15 May 2001 | 2430 |
11 May 2002 | 2670 |
26 Jun 2003 | 560 |
27 Aug 2004 | 3000 |
12 Apr 2005 | 859 |
30 Nov 2005 | 710 |
23 Aug 2007 | 2390 |
11 May 2008 | 3160 |
27 Aug 2009 | 2520 |
09 Aug 2010 | 3750 |
14 Jun 2011 | 2600 |
14 Apr 2012 | 1450 |
28 May 2013 | 3850 |
10 Sep 2014 | 1200 |
*gage height affected by backwater
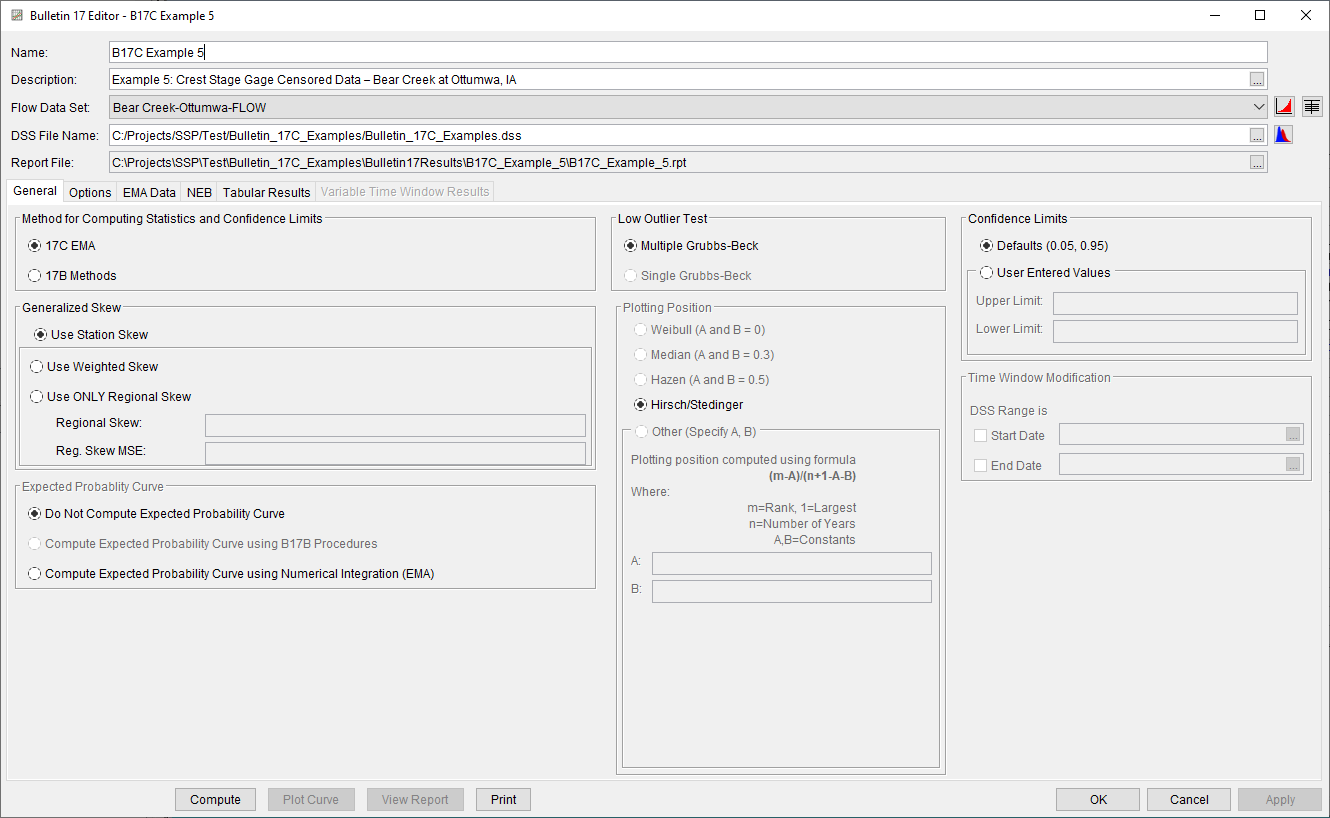
A Bulletin 17 Analysis using EMA and Bulletin 17C procedures has been developed for this example. To open the analysis, either double-click on the analysis labeled "B17C Example 5" from the Study Explorer or from the Analysis menu select open, then select "B17C Example 5" from the list of available analyses. When "B17C Example 5" is selected, the Bulletin 17 analysis editor will appear as shown in Figure 2. As shown, the Skew option was set to use the Station Skew.
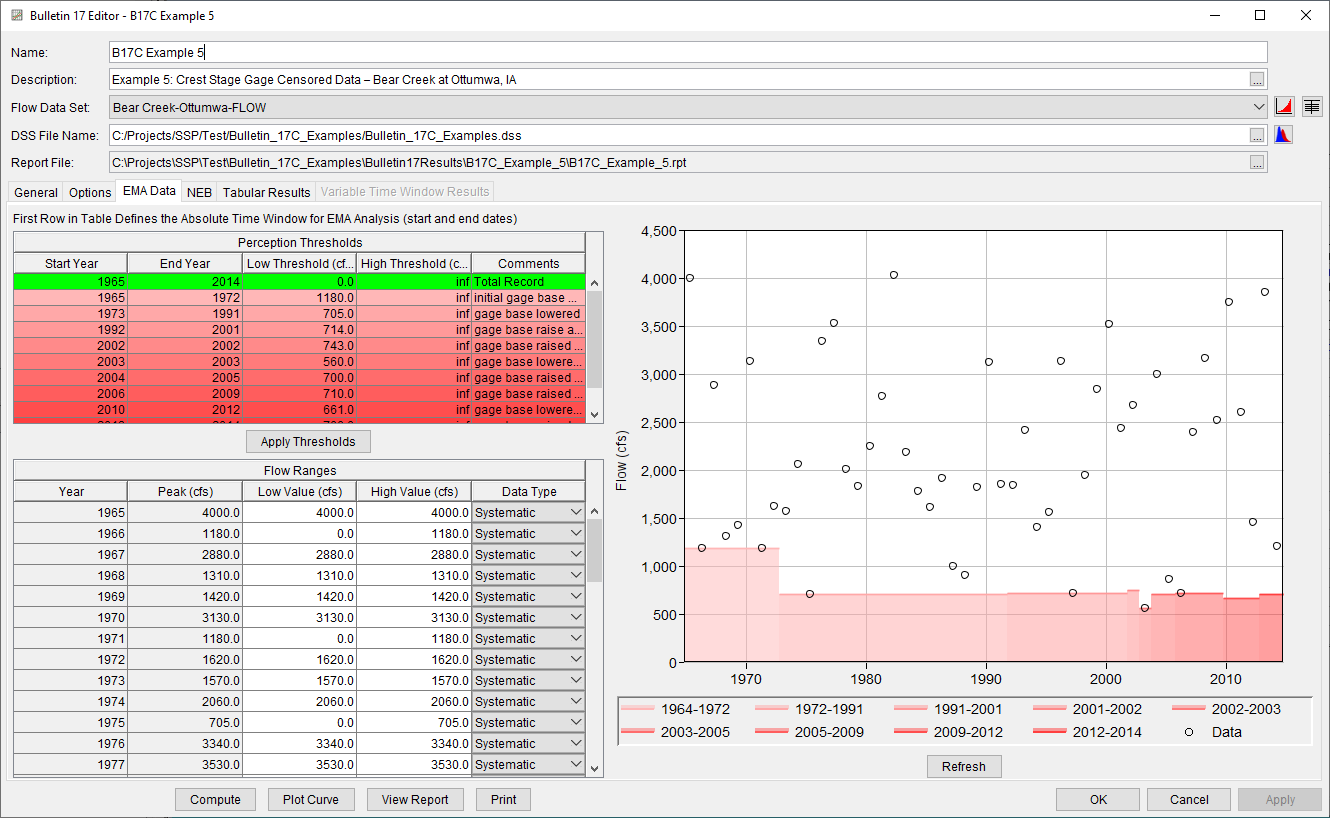
No changes to the Options tab are necessary. The EMA Data tab for this example is shown in Figure 3. This example uses an annual maximum series consisting entirely of systematic data. However, physical changes to the actual gage base (i.e. minimum recordable flow rate) occurred in 1973, 1992, 2002, 2003, 2004, 2006, 2010, and 2013. To take the possibility of annual peak flows occurring below the gage base into account within the EMA framework, perception thresholds are required for each change in the gage base, replacing the typical low value of zero for systematic observations with a low value equal to the gage base. For instance, the gage base was lowered from the initial setting of 1180 cfs to a gage base of 705 cfs in 1973. The next gage base change occurred in 1992. This requires a perception threshold of 705 – inf for water year 1973 through water year 1991. For information related to a specific crest stage gage, such as the gage base, consult your local USGS office. A total of nine different gage bases have been in effect for this gage. Including the first perception threshold (which sets the start and end year of the analysis), this requires a total of 10 perception thresholds. Once all perception thresholds have been entered as shown in Figure 3, click the Apply Thresholds button to assign the complementary flow ranges for the periods of missing data.
A peak flow rate below the gage base occurred in 1966, 1971, 1975, 1988, 1997, and 2006, as signified by the USGS qualification code of 4. This implies that the actual annual peak flow rate could have been between zero and whatever the gage base was at the time. This information requires a change to the flow range table. For each of these years, a low value of zero and high value of whatever the gage base was at the time should be entered. For instance, in water year 1966, the annual peak flow rate was below the gage base of 1180 cfs. Therefore, the flow range for that year should be entered as zero – 1180, as shown in Figure 3. The other five water years in which an annual peak flow was below the recordable limit should be entered in a similar fashion within the flow range table.
Once all of the General and EMA Data tab settings are set or selected, the user can press the Compute button to perform the analysis. Once the computations have been completed, a message window will open stating Compute Complete. Close this window and then select the Tabular Results tab. The analysis window should resemble Figure 4.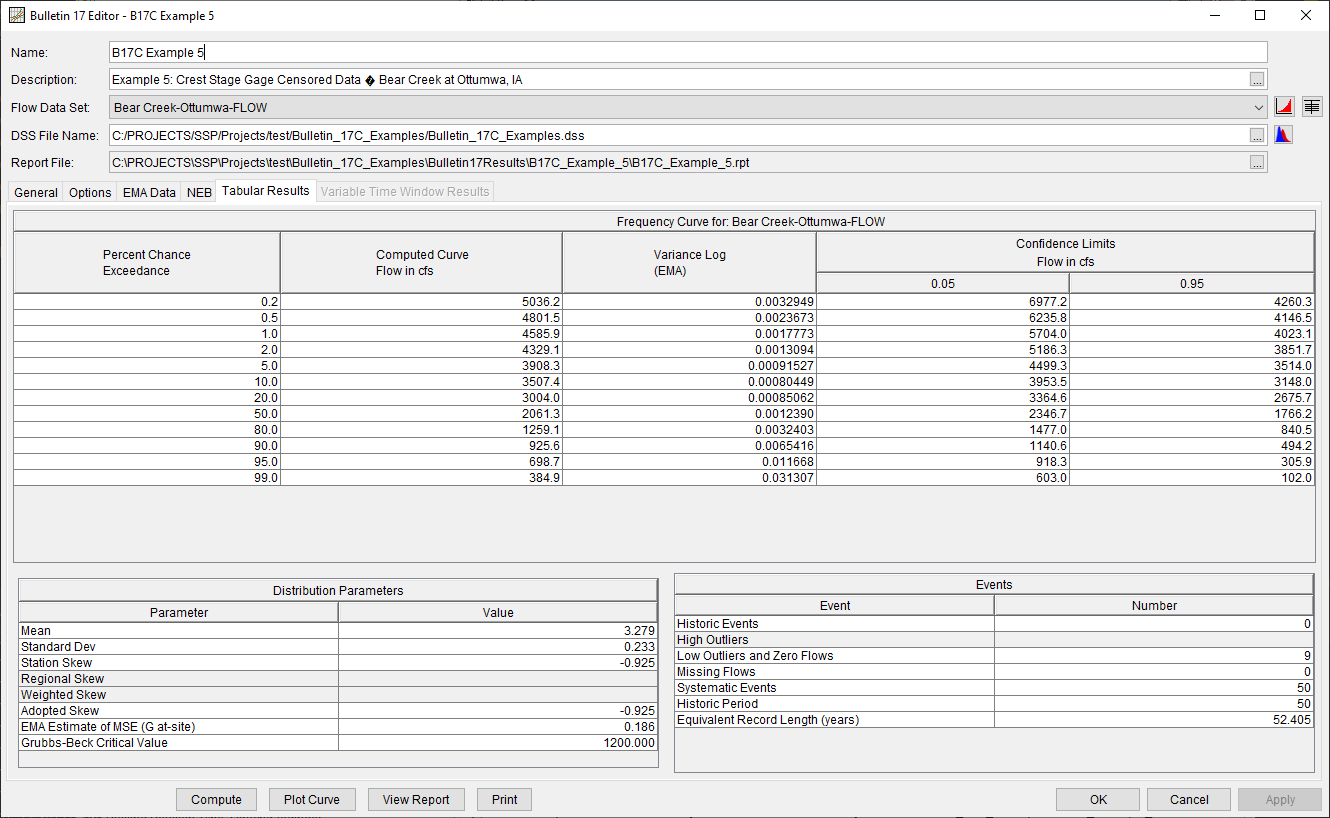
In addition to the tabular results, a graphical plot of the computed frequency curves can be obtained by pressing the Plot Curve button at the bottom of the analysis window. The Log Pearson Type III distribution fit using EMA to the input annual maximum flow data set, the 5% and 95% confidence limits, and the computed plotting positions are shown in Figure 5.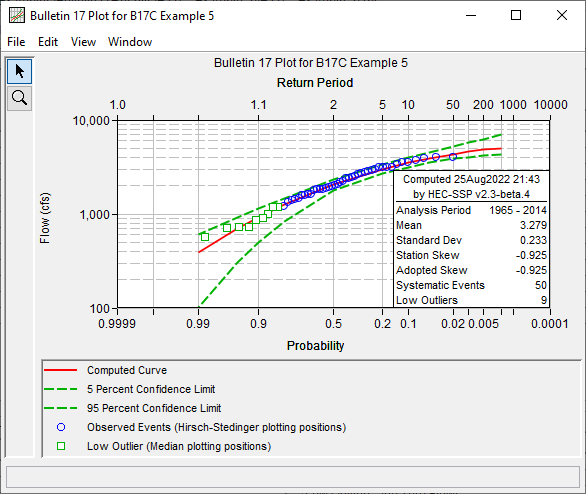
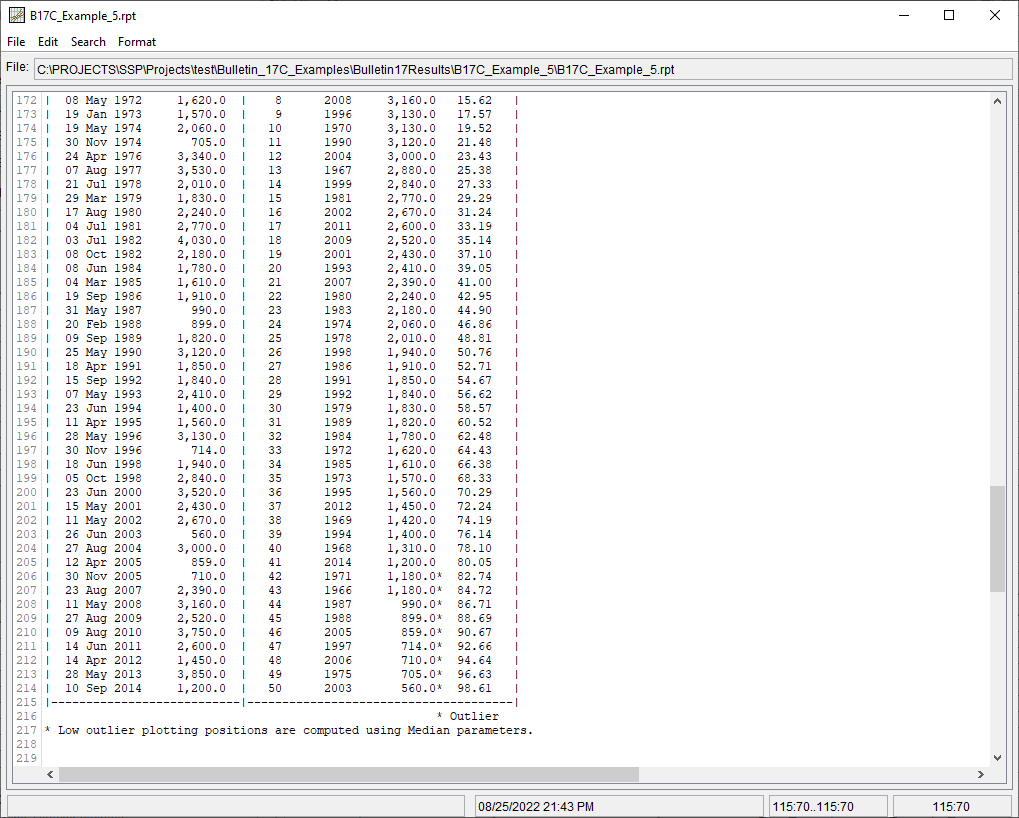
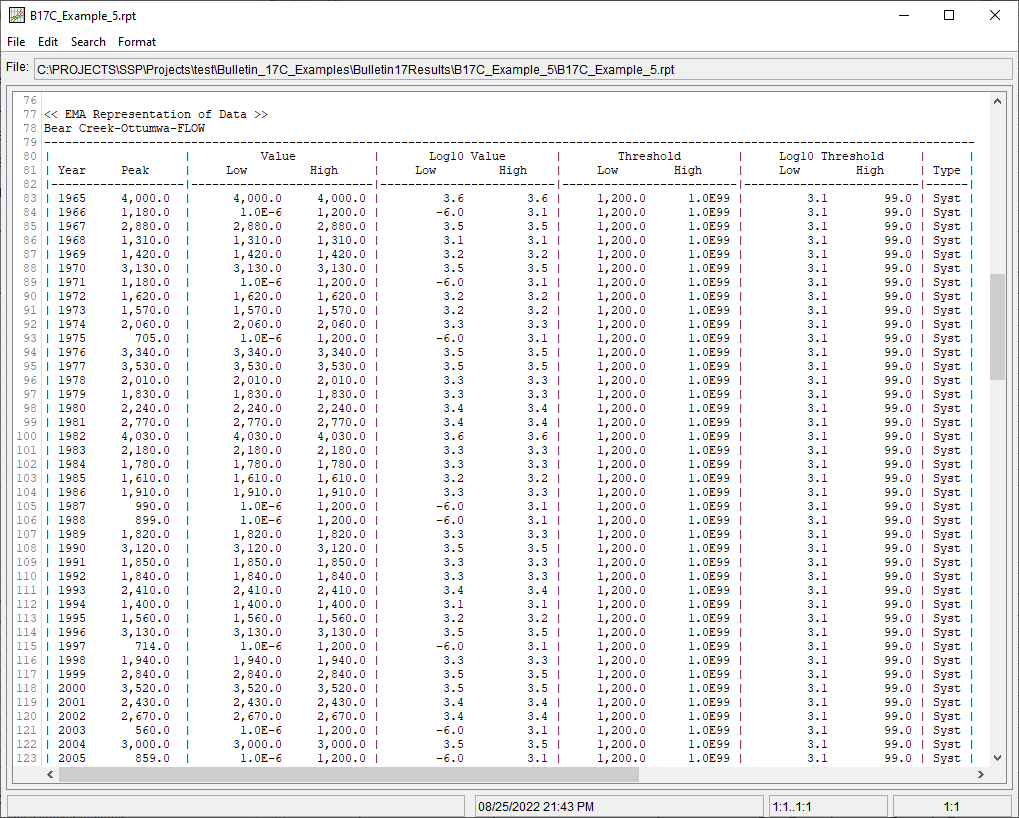
As shown in Figure 4, the Multiple Grubbs-Beck Test identified a low outlier threshold (critical value) of 1200 cfs, which corresponds to the smallest peak that was retained. Nine annual peak flows were identified and censored, as shown in Figure 6. These annual peak flows were then recoded to have a flow interval of zero – 1200. The perception threshold for all systematic observations were also adjusted to correspond with the Multiple Grubbs-Beck Test low outlier threshold (i.e. 1200 – inf), as shown in Figure 7.
