Download page Data Filtering, Using Multiple Filters.
Data Filtering, Using Multiple Filters
This example demonstrates how to use multiple nested filters to extract an annual maximum series from another time series. The original data for this example consists of unregulated daily average inflows to Palisades Lake which is located along the Snake River near Irwin, ID. The period of record used for this example is from 1927 to 2010. To view the data from HEC-SSP, right-click on the data record labeled "Palisades Dam-Daily Inflow" in the study explorer and then select Plot. A plot of the data will appear as shown in Figure 1.
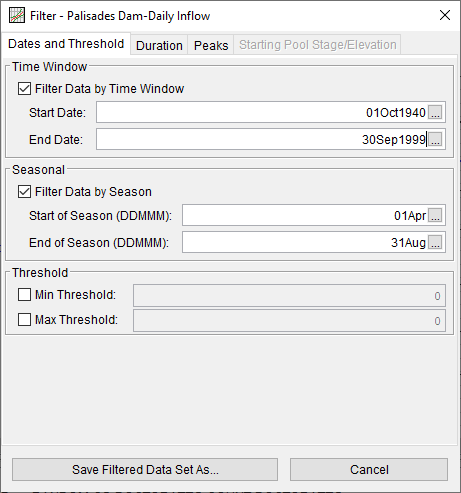
To begin extracting an annual maximum series, right click on the Palisades Dam-Daily Inflow data record and select Filter Data. Within the Filter editor, click the Filter Data by Time Window check box and enter a Start Date of 01Oct1940 and an End Date of 30Sep1999. Also, click the Filter Data by Season check box and enter a Start of Season of 01Apr and an Endof Season of 31Aug. On the Peaks tab, within the Annual Maxima panel, click the Filter to Annual Maxima check box and enter a Start of Year of 01Oct, as shown in Figure 2.
After clicking the Save Filtered Data Set As button, enter a Name of "Palisades Dam-Daily Inflow-AMS", ensure the E-part is set to IR-CENTURY, and the F-Part is defined as "NO REG NO IRRIGATION - AMS", as shown in Figure 3.
After clicking the OK button, a new data set will be added to the study. Out of the original 30224 values, 59 values remained after applying the aforementioned data filters. These 59 values constitute an annual maximum series of daily average streamflow occurring between 01Apr and 31Aug. The original data as well as the filtered data is shown in Figure 4.