Download PDF
Download page Using a Correlation Analysis for an Interior Drainage Study.
Using a Correlation Analysis for an Interior Drainage Study
Overview
This tutorial provides an example application of the Correlation Analysis functionality. In this example, a correlation analysis will be used to determine how closely related precipitation in the interior of a leveed area is with river stages on the exterior of the leveed area. HEC-SSP version 2.3 beta.1 was used to create this example.
Download a copy of the initial HEC-SSP project here – Correl_InteriorDrainage_Initial.zip
Introduction
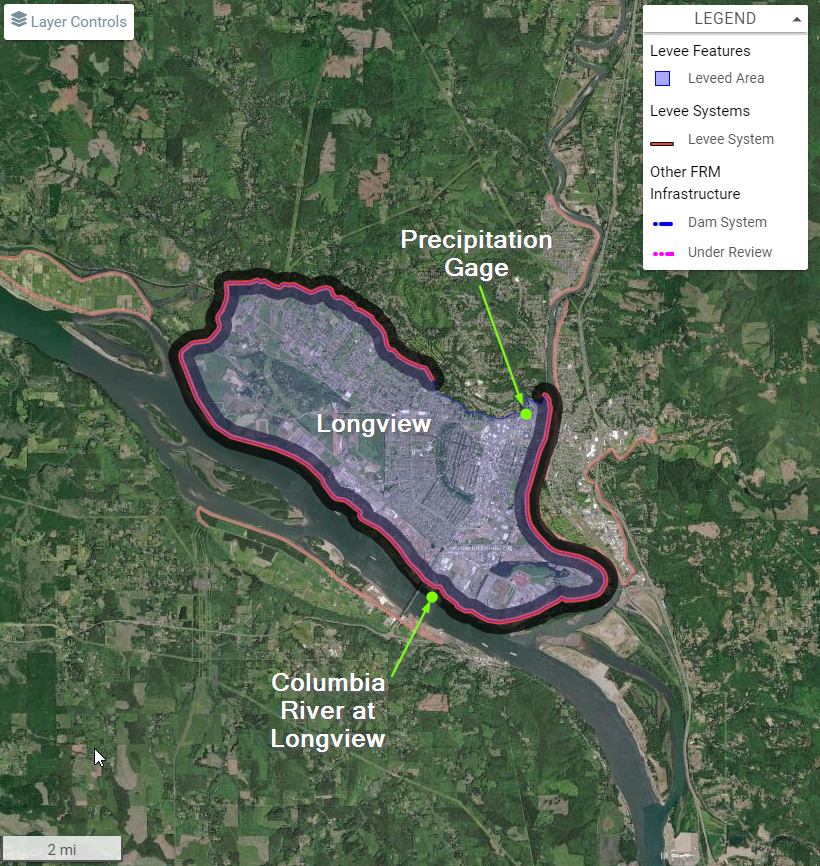
Open the example HEC-SSP project. In this example, the leveed area of interest is the Cowlitz CDID1 system, which encompasses most of the city of Longview in southwest Washington.
https://levees.sec.usace.army.mil/#/levees/system/5005000022/summary
Levee systems are built to reduce the chance of floodwaters impacting developed areas. However, when a levee is constructed, it prevents the natural flow of water from areas inside the leveed areas to waterbodies where they would naturally drain. This issue is known as interior drainage, and it is covered at length in EM 1110-2-1413. If no mechanism is provided to expel the water from the interior areas, water would pond inside the leveed area and cause damages. Ponding can occur from stormwater or creeks that would normally flow through the interior area. Typical mechanisms to drain interior areas include gravity outlets and pump stations. Gravity outlets can be opened during times when the water on the exterior of the levee is lower than the ponding in the interior of the levee. Very few levee systems rely solely on gravity outlets, except in coastal areas where low tides consistently occur when the gates can be opened to drain the system. Pump stations are often used when the water on the exterior side is higher than the interior side.
As part of an interior drainage analysis, an evaluation of the correlation of interior runoff to exterior stage is needed. In our example, the interior runoff occurs largely from stormwater from the City of Longview. Precipitation in the City of Longview is the best indicator of how much water needs to be drained from the interior areas. The exterior stage is the Columbia River, where pump stations discharge water. The objective of this analysis is to determine how closely related precipitation in Longview is with stage on the Columbia River.
Datasets
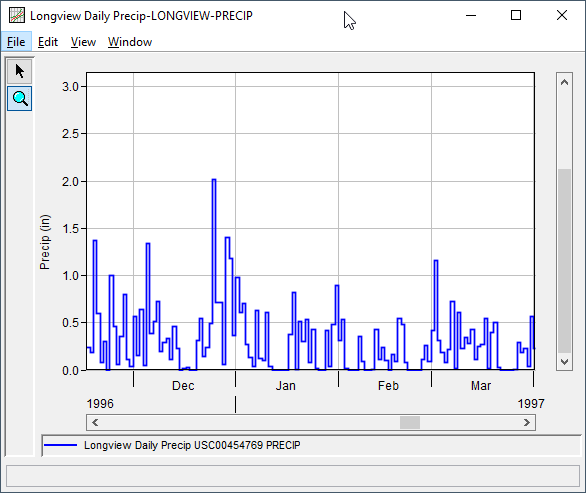
Daily accumulated precipitation amounts were retrieved at Longview from the National Centers for Environmental Information (NCEI). The precipitation dataset extends from 1925-2020. It has already been included in the SSP project, but it was sourced here: https://www.ncdc.noaa.gov/cdo-web/datasets/GHCND/stations/GHCND:USC00454769/detail.
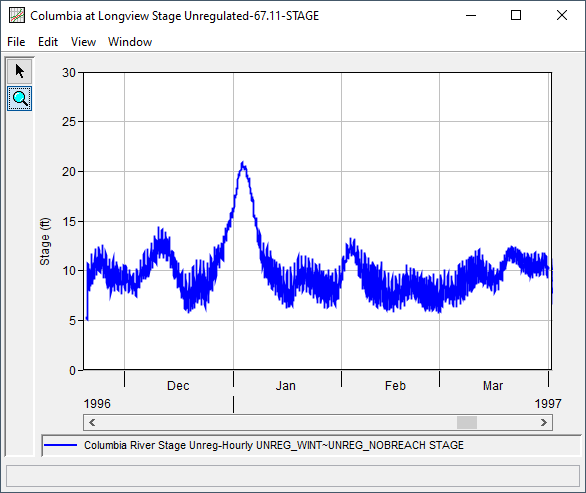
Stage on the Columbia River at Longview is more complex. Flow in the Columbia River is influenced by large amounts of upstream storage that has been constructed over time. The observed stage dataset at Longview is not homogenous, which makes it unusable for this correlation analysis. Instead, either an unregulated stage dataset or a modeled dataset including current-day reservoir operations should be used. In this case, the unregulated dataset was used. An hourly stage dataset at Longview was developed by running unregulated flows through an HEC-RAS model of the Lower Columbia River from 1929-2008. The dataset includes the period November 20-March 31 for all years, which is the time window when large precipitation events at Longview could occur in coincidence with high Columbia River stages. There is a tidal signal in the dataset, even though Longview is nearly 70 miles upstream of the mouth of the Columbia River. The tidal signal is greatly dampened during a riverine flood, though. As a result, the daily maximum values of this hourly dataset are used in this correlation analysis rather than the hourly data. This dataset has also been included in the SSP project. The datasets are shown for WY 1997 as an example:
Analysis Approach
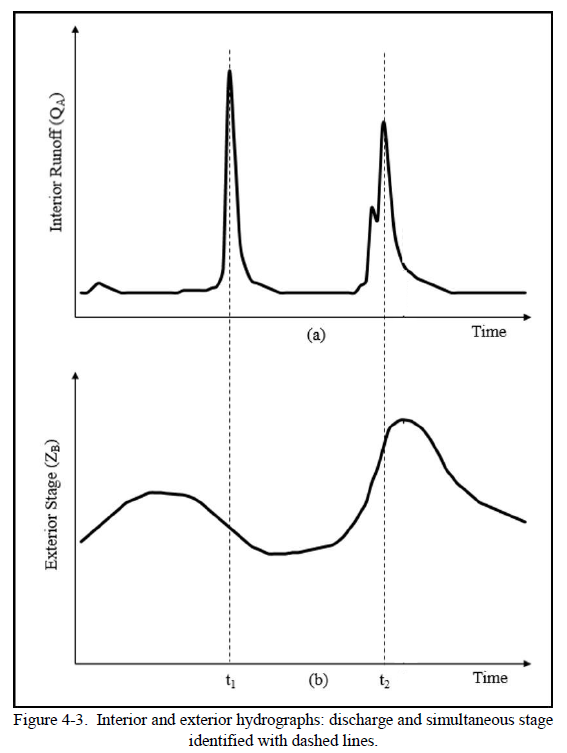
For this application, the goal is to determine the relationship between interior runoff and exterior river levels at times of peak interior runoff. Therefore, the annual maximum values from each dataset would be inappropriate to use, since they might occur at very different times. The correlation analysis should use the annual maximum values of the precipitation gage, since it represents the interior runoff. The exterior river stage for the correlation analysis should be coincident in time with the maximum precipitation event (within a day of the date of each annual maximum precipitation event). If only a few years of record are available, multiple independent precipitation events for each year could be extracted and used for the correlation analysis instead of only using annual maximums. The schematic below (adapted from EM 1110-2-1413) represents this concept.
Create the Correlation Analysis
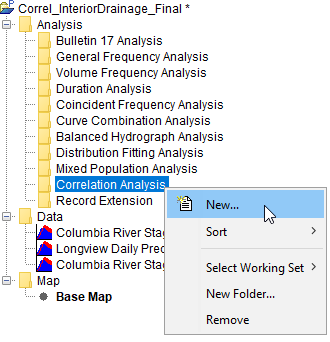
- Create a new Correlation Analysis by right clicking on the folder in the tree and selecting New. Enter a name for the Correlation Analysis, like Longview Interior.
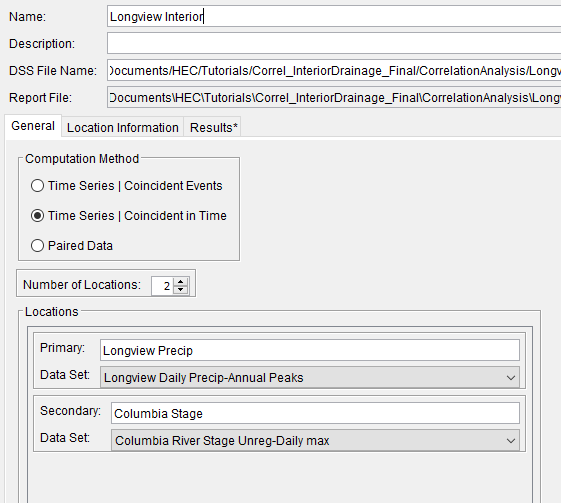
- Select Time Series | Coincident in Time as the Computation Method. This method requires a single primary site that the event time windows will be extracted from, and secondary sites where the maximum value will be extracted over these windows.
- Change the Number of Locations to 2.
- Under the Locations heading, use the drop down menus to select the Longview Daily Precip-Annual Peaks as the Primary Dataset. Select the Columbia River Stage Unreg-Daily max as the Secondary dataset. Provide a name for each of the datasets. The resulting window should resemble the following figure.
- Go to the Location Information tab. Each site is displayed as a tab. With annual maximum peak flow datasets, typically correlations are computed on the logarithms of the peak flows. For precip and stage data, log transforms are not typically used. Thus, leave the Transformation as None.
- Press Compute. Note the warning messages about a few events dropped from the analysis because no stage data was available (e.g. 2009-2021).
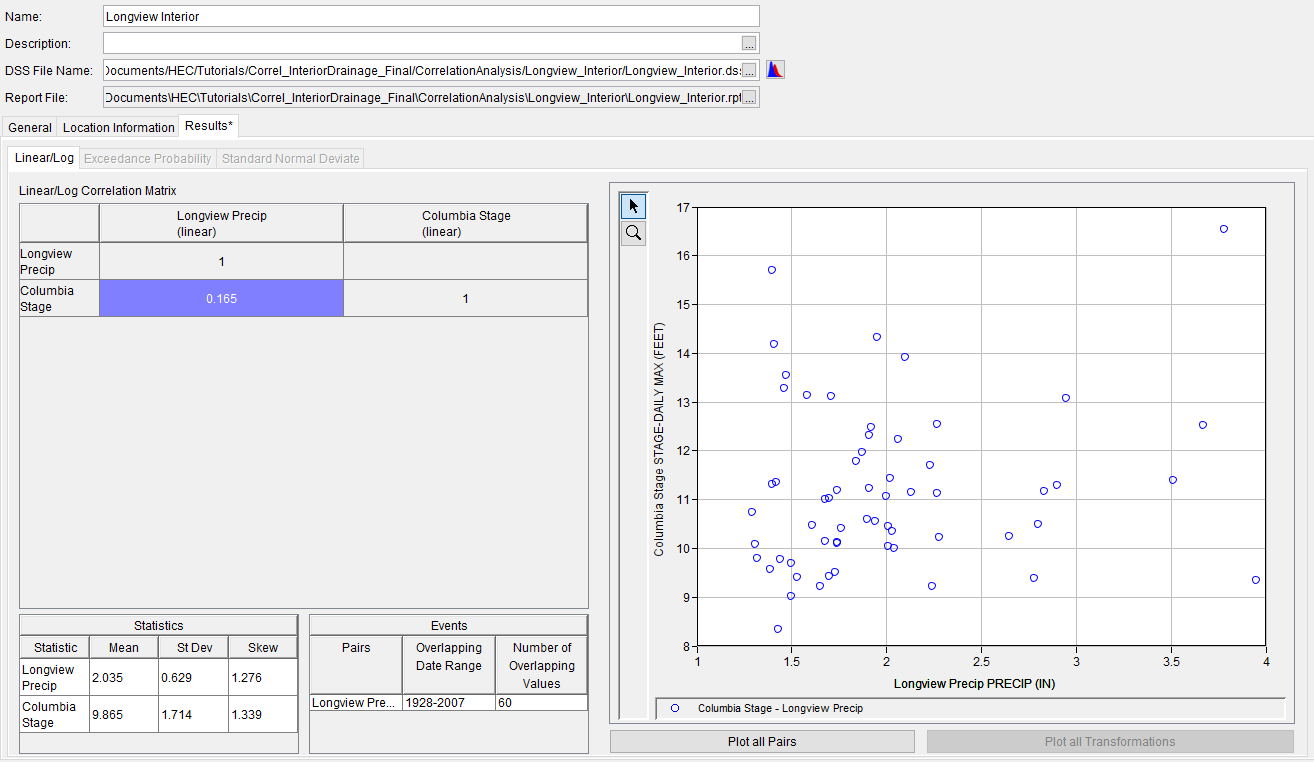
- Go to the Results tab. The computed correlation matrix between the input data sets is shown below. The correlation coefficient is very weak: 0.165. Per EM 1110-2-1413, datasets are often considered effectively independent when r < 0.4. In this case, it appears the precipitation at Longview has no relationship to unregulated river levels on the Columbia River. This makes physical sense, since the Columbia River has a very large drainage area compared to the Longview stormwater system. This is very valuable information for an interior drainage analysis, as the assumption of independence greatly simplifies a coincidence analysis that is likely the next step in the project.
The example here used maximum values over a day. If a longer duration storm event is more indicative of interior runoff (e.g. 3-day), the same process could be applied to that dataset.