Download PDF
Download page Part 1. Dice Experiment.
Part 1. Dice Experiment
Download Excel file:  Dice experiment 2025.xlsm
Rolling a 6-sided die
12 rolls. Take a 6-sided die, and attempt to determine the probability of rolling a 4. Do this by computing the relative frequency of rolling a 4 after 12 rolls. Relative frequency = (# times roll 4) / (# rolls)
Question 1: How many times did you roll a 4, and so what is your estimated probability of rolling a 4? How many times did you expect to roll a 4?
Question 2: Do you think 12 is enough rolls to determine the probability of rolling a 4?
No, it’s unlikely to see exactly 2 rolls of each side in 12 rolls, due to sampling error. So, the probability estimate will probably not be correct.
Letting the computer roll a 6-sided die
Open spreadsheet titled “dice experiment.xlsm” You should find yourself on the tab labeled “12” Dice experiment 2025.xlsm
In the upper left, you’ll see cells set up to randomly sample a roll of a fair 6-sided die, with a random U[0,1] in the first column, and an algorithm to adjust it to integers 1 through 6 in the second column. Rows are set for 12 rolls, but only one outcome has the equations and shows a value. Hit F9 a few times to see different outcomes. Review the equations in the 2 cells, which together capture the probability 1/6 for each outcome, or are equally likely to produce an integer value between 1 and 6.
Copy the equations into the remaining 11 cells. Hit F9 a few times, and notice that 12 new rolls will be produced each time.
To the right of the rolls you’ll find the computation to produce a histogram (estimated PMF) of the sample, showing both count and relative frequency of each possible outcome (1 through 6). The estimated probability of rolling a 4 is highlighted, and the histogram is plotted to the right. Examine the computation of the count, which uses array function {=frequency(array,bins)}, and the relative frequency, which is count/#rolls.
Note that each time you hit F9, producing a new experiment of 12 rolls, the counts and plotted histograms all change.
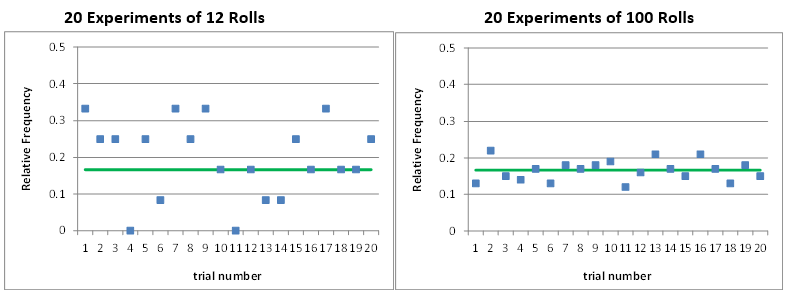
Repeat Experiment. To the right of the histogram plot is an area set for you to record 20 trials of this experiment. Put your cursor in the blue cell under “count” (cell Q10) and press the paste result button above. The estimated probability of rolling a 4 will be recorded in that row, and a new sample of 12 rolls is initiated. Each time you press the button, it will copy the next result and move the cursor down. Continue pasting results until you’ve filled out the 20 experimental values of the estimated probability of rolling a 4. Study the figure below the 20 trials, which plots those estimates, along with the true probability of 1/6.
Question 3: How do we know the true value is 1/6 for this experiment?
The equations entered to represent the die roll produce equally likely values between 1 and 6.
Question 4: Does the experiment do a good job of estimating the probability of rolling a 4 on a 6-sided die?
No, the estimate rarely gave the answer we know to be correct.
100 rolls. Go to the tab labeled “100” This tab does the same experiment, but with 100 rolls of the die rather than 12. Examine the equations that produce a roll of the die.
Question 5: How do the equations producing a single roll differ from the 12 roll experiment?
The equations are identical. We’re still simulating the roll of a 6-sided die. We’re just doing more rolls in this experiment.
Hit F9 a few times to study the resulting histogram of each trial of the experiment.
Repeat the generation of 20 samples, using the “paste result” button to record the results in the range to the right of the histograms. Compare the results of 20 trials of the 100-roll experiment to the 20 trials of the 12-roll experiment.
Question 6: How do the results of the 100-roll experiment differ from the 12-roll experiment?
The estimates of the probability of rolling a 4 are all closer to the actual value.
1,000 and 10,000 Rolls. The spreadsheet also has tabs for experiments of 1,000 rolls and 10,000 rolls of the 6-sided die, still attempting to estimate the probability of rolling a 4. Study those results to build your understanding of the relationship between sample size and accuracy of the probability estimate. Re-run the 20 trials if you’d like.
Question 7: Do the 1,000-trial experiment and the 10,000-trial experiment support your answer to the last question?
If your answer to the last question was that 100 rolls did better than 12, then yes. These experiments of 1,000 and 10,000 rolls support that fact that a larger sample will be more representative of the true population and probability distribution, and so give better estimates of the probabilities.
Save the spreadsheet, and close it.
Excel Solution File: Dice experiment solution 2025.xlsm