Download PDF
Download page Task 1. Import and Filter Data in HEC-SSP.
Task 1. Import and Filter Data in HEC-SSP
Import Mean Daily Flow
- Create a new HEC-SSP study called "PDS_Workshop".
- Select Data | New | Using Import Wizard from the top ribbon or right click on the Data folder and select New | Using Import Wizard.
- Select the Next> button to accept the defaults on the first screen of the wizard.
- Select USGS Website as the Source on the second screen and click Next>.
- Select Daily as the Data Type.
- Enter the following under Daily Options:
- Start Date: 01JAN1935
- End Date: 31DEC2023
- Select UTC as the Time Zone.
- Leave the Flow check box selected.
- Click the Get ID's for State button. Select Illinois in the state drop-down menu and click OK. The Import From USGS Data screen should appear as below.


We are filtering to calendar years 1935-2023 and will use 01 January as the start of the year because the WY 1986 and WY 1987 peaks occur on 29 September 1986 and 01 October 1986, respectively, and are therefore not independent. We want to avoid violating the independent and identically distribution (IID) assumption in parametric modeling.
- Click Next>.
- In the field under USGS Station ID's enter the USGS gage ID for Apple River at Hanover, IL (05419000). Click the Enter key to search.
- You should see a single row in the table, as below.

- Click the checkbox under the Import Data header and click Next>.
- Review your inputs/selections one more time before clicking Import.
- You should see a dialog appear with the imported data shown in a table and plotted in a graph, as below.

- Click Close.
Extract Annual Peaks
- Select the Apple River at Hanover, IL mean daily flow time series under the Data folder in the Study Explorer.
- Right click and select Filter Data or from the top ribbon, select Data | Filter Data.
- No changes are needed on the Dates and Thresholds.
- On the Peaks tab, select the Filter to Annual Maxima checkbox in the Annual Maxima panel.
- Leave the default of "01Jan" in the Start of Year field.
- Click the Save Filtered Data Set As button.
- Edit the Name and F-part fields to include "AMS" as shown below.

QUESTION 1: How many events are in the annual maximum series? What are the magnitudes of the minimum and maximum annual peak?
There are 89 annual peaks in the 89 years of record. The minimum and maximum annual peaks are 615 and 15200 cfs, respectively.
Extract Partial Duration Series
- Select the Apple River at Hanover, IL mean daily flow time series under the Data folder in the Study Explorer.
- Right click and select Filter Data or from the top ribbon, select Data | Filter Data.
- Leave the Dates and Thresholds tab blank.
- On the Peaks tab, select the Filter Data by Peaks Over Threshold (Partial Duration) checkbox in the Peaks Over Threshold (Partial Duration) panel.
- Enter the following:
- Minimum Threshold (cfs): 750
- Duration of time between peaks (days): 5
- Method for Computing Magnitude Differential | Defined Threshold Value (cfs): 250

- Click the Save Filtered Data Set As button.
- Edit the Name and F-part fields to include "PDS1" as shown below.

- Click the OK button.
- Repeat the above steps to create 5 more PDS data sets, defined in the table below. Note that the Method for Computing Magnitude Differential | Defined Threshold Value (cfs) for all data sets is 250 cfs.
- Double check your inputs before saving each filtered data set!
| Filtered Data Set | Minimum Threshold (cfs) | Duration of Time Between Peaks (days) | Magnitude of Differential - Defined Threshold Value (cfs) |
|---|---|---|---|
| PDS1 | 750 | 5 | 250 |
| PDS2 | 1250 | 5 | 250 |
| PDS3 | 2500 | 5 | 250 |
| PDS4 | 750 | 11 | 250 |
| PDS5 | 1250 | 11 | 250 |
| PDS6 | 2500 | 11 | 250 |
QUESTION 2: How many of the annual maximum series events are excluded from all of the partial duration series?
Two of the AMS events are below 750 cfs and are therefore excluded from all PDS.
- Open the Excel spreadsheet titled "Mean_Excess_Start.xlsx" linked at the top of the previous page (Partial Duration Series using HEC-SSP and Excel). Use this spreadsheet to compute the mean excess of each partial duration series.
To calculate mean excess:
- Copy each PDS into its respective column (look at the headers in row 3).
- Click in the first cell in the Excess column to see the equation: Excess = Event Magnitude - Threshold
- Click in the Mean Excess cell to view the equation.
QUESTION 3: How many events are in each partial duration series (PDS1 through PDS6)? What is the event rate (number of events/number of years) for each partial duration series? What is the mean excess value of each PDS? Does the mean excess increase or decrease as the threshold value is increased?
Hint: for the event rate, divide the number of events in each PDS by the number of years (89).
The number of events in each PDS and the mean excess of each are shown in the table below. In addition, the mean daily time series, PDS4, PDS5, and PDS6 are plotted below.
| Filtered Data Set | Number of Events | Average Event Rate (events/year) | Mean Excess (cfs) |
|---|---|---|---|
| PDS1 | 372 | 4.18 | 1587 |
| PDS2 | 247 | 2.78 | 1785 |
| PDS3 | 100 | 1.12 | 2385 |
| PDS4 | 338 | 3.80 | 1658 |
| PDS5 | 231 | 2.60 | 1831 |
| PDS6 | 96 | 1.08 | 2410 |
The mean excess value increases as the threshold value is increased from 750 to 1250 to 2500 cfs.
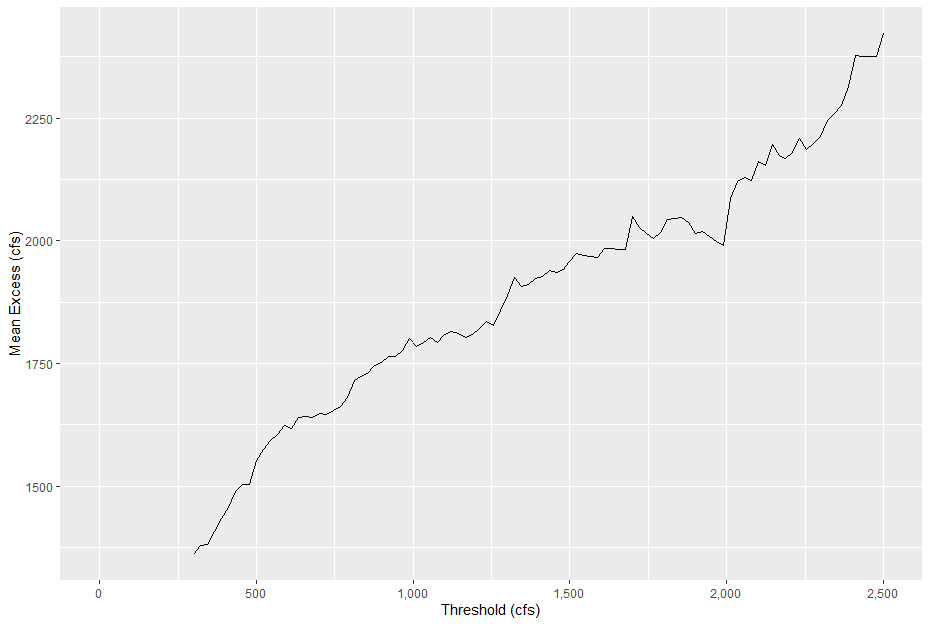
Significance of Mean Excess
In Task 2, you will use PDS5 to fit a Generalized Pareto distribution. However, when selecting a partial duration series for frequency analysis, threshold selection is important and is determined through the use of diagnostic plots. One way to select an appropriate threshold is to plot the mean excess of the partial duration series against a sequence of threshold values and pick a threshold value where the mean excess plot exhibits a break from linearity. In this task, you only computed the mean excess for 3 threshold values with different time separation criteria. Here is the mean excess plot for threshold values ranging from 300 to 2500 cfs at Apple River:
The mean excess plot is typically used in combination with other diagnostic values to select a threshold. If you are interested in learning more about threshold selection and time separation in partial duration series, check out this tutorial: Flood Separation and Threshold Choice Workshop
Continue to Task 2. Fit Distributions using the Distribution Fitting Analysis in HEC-SSP.