Download PDF
Download page USGS StreamStats Demonstration.
USGS StreamStats Demonstration
Demonstration
This set of instructions is meant to be a very brief introduction to some of the uses of USGS StreamStats and will be delivered as a live, instructor-led session during the Flood Frequency Analysis course.
Launch USGS StreamStats
Open StreamStats in a browser using this link: https://streamstats.usgs.gov/ss/
Define Study Area
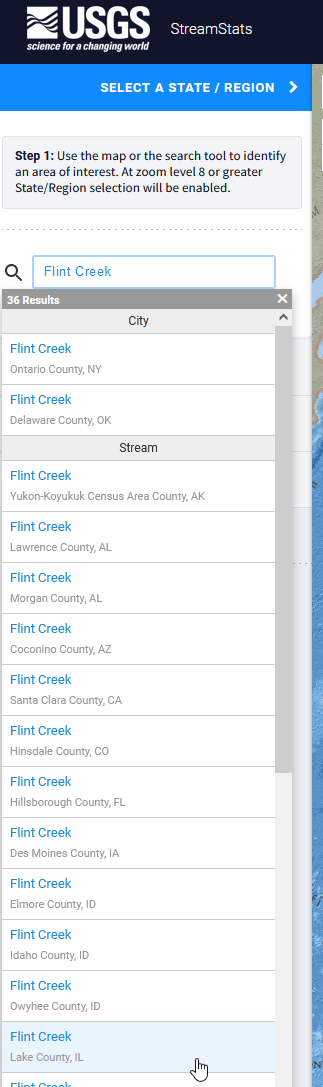
In the search box on the left side, search for "Flint Creek". The search will spin for a moment and then the results will update. Towards the bottom of the list will be "Flint Creek Lake County, IL". Click on this result.
The map will generate a red dot with a callout. Zoom all the way into the selected location. This is at the mouth of the stream of interest where it flows into a larger river. We will do our analysis upstream a little bit at the gage location indicated by a blue triangle (Flint Creek near Fox River Grove, IL).
Select the "Illinois" study area button on the left side. This activates the stream lines layer. Click the delineate button. Click on the road line (Kelsey Rd) just south of the USGS gage location where it intersects with the blue delineation line, just a couple pixels south of the USGS gage location. Later, we will compare the StreamStats scenarios to frequency estimates made using data at the gage.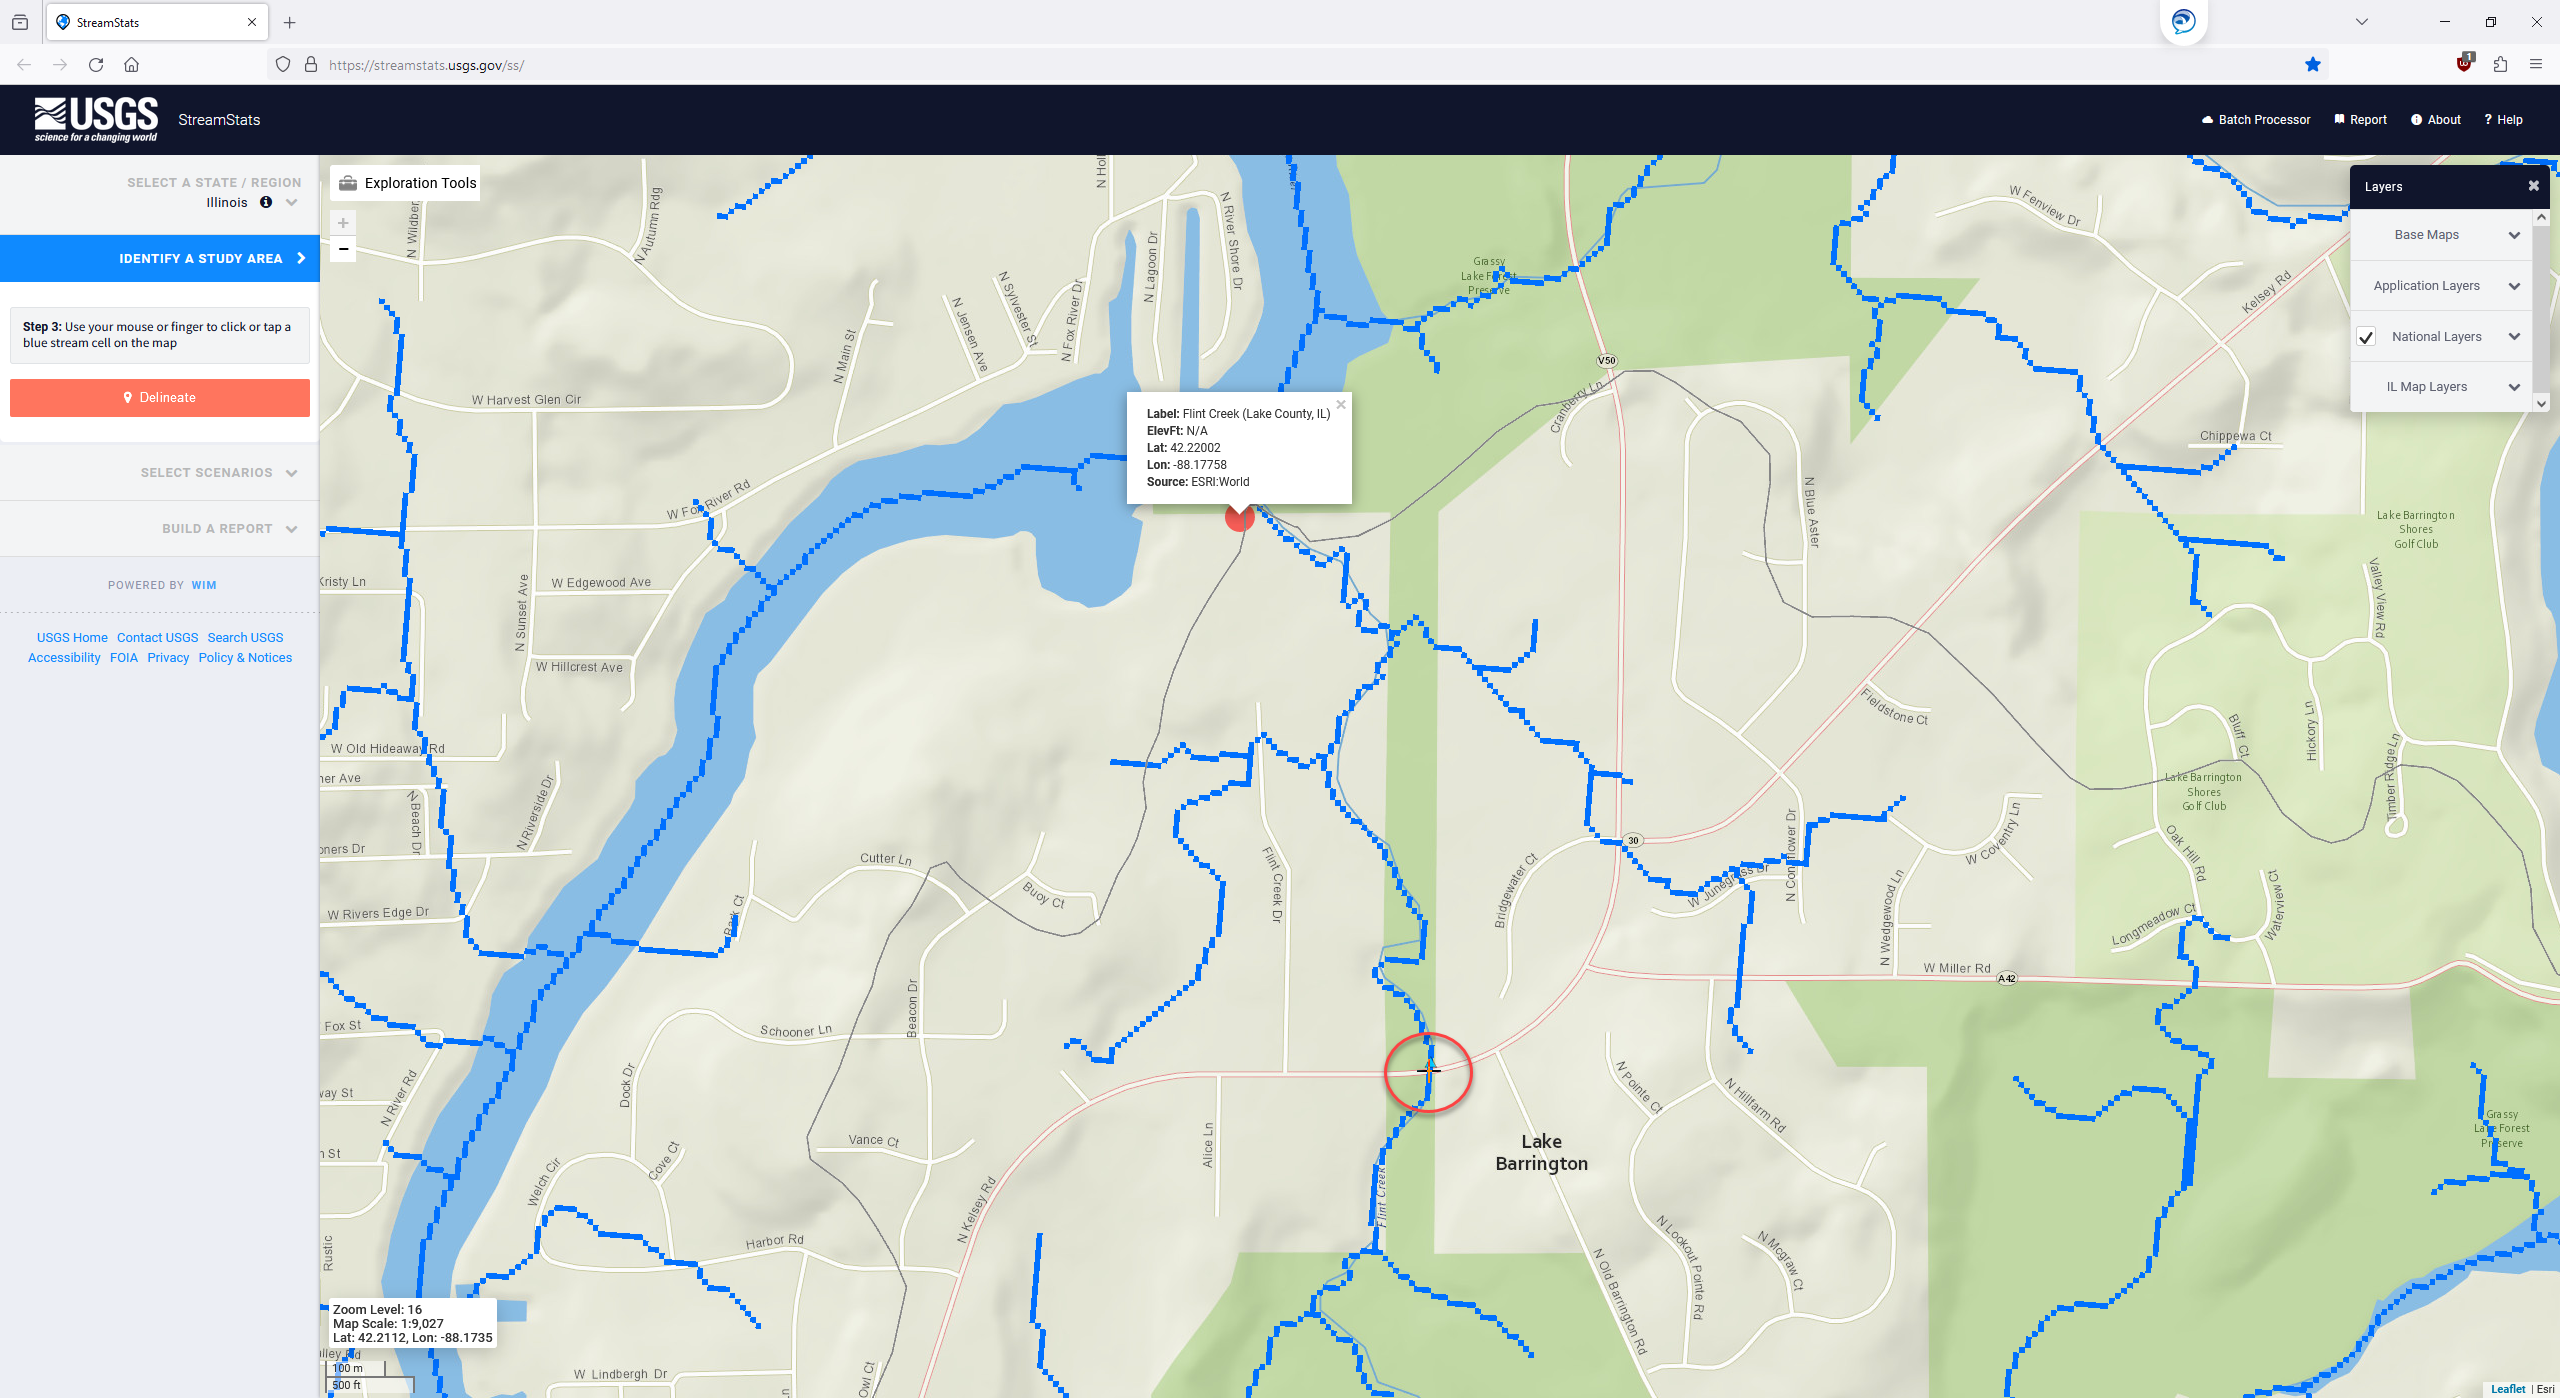
The delineation process will run, this will take a few seconds after verifying the point is ok. After producing a result, it will zoom out to show a yellow polygon. If you wanted, you could download the polygon you just delineated and use it for other things. For now we will select "Continue" to allow StreamStats to analyze the drainage area. This will query the study area's regression equations.
Choose and Run Scenarios
On the left side you'll see that there are a few "Regression Based Scenarios". We're usually interested in Peak-Flow Statistics, but the other three (Flow-Duration Statistics, Bankfull Statistics, and Maximum Probable Flood Statistics) are useful for other things too. Let's select all four. Click on them so that they're all highlighted in blue. You can also select additional Basin Statistics on this step, but for now, we will leave the defaults selected. Then, select "Continue".
StreamStats will calculate all the basin statistics that are needed as inputs to the regression models used to make predictions for the scenarios we selected. After it's done, you can look at a few key basin characteristics, or view them in the report with all the scenario reports. Leave the two checkboxes selected and click "Open Report".
In the window that opens you can customize the report name and add any comments you'd like as you can download or print the report at the very end.
The report contains the following:
- A map of the delineated drainage area
- A list of the computed basin characteristics used in the regression models, their description, and the computed value
- The peak flow statistics report, including a frequency curve
- The flow-duration statistics report
- The bankfull statistics report, useful for geomorphology and other things
- An estimate for the probable maximum flood based on a regional envelope curve approach
The report can be given a name and comments can be added at the top, and it can be printed to a PDF such as this: StreamStats_FlintCreekReport.pdf
Compare to At-Site Frequency Curve
USGS peak flow data were imported into HEC-SSP v2.3 and a Bulletin 17C/EMA curve were generated.
This is definitely a site where the regression could help us, there are a couple bad things going on here in the time series:

First this is clearly nonstationary. Second, there's not a lot of data here. Third there's a big gap in the record from 1977-1989. As a fun addition, the 1960 peak just before the systematic record is a code 7 (historical).
This site is undergoing severe urbanization, especially in the 1980s and 1990s.
EMA can be used to add information about some of the missing periods in the record:
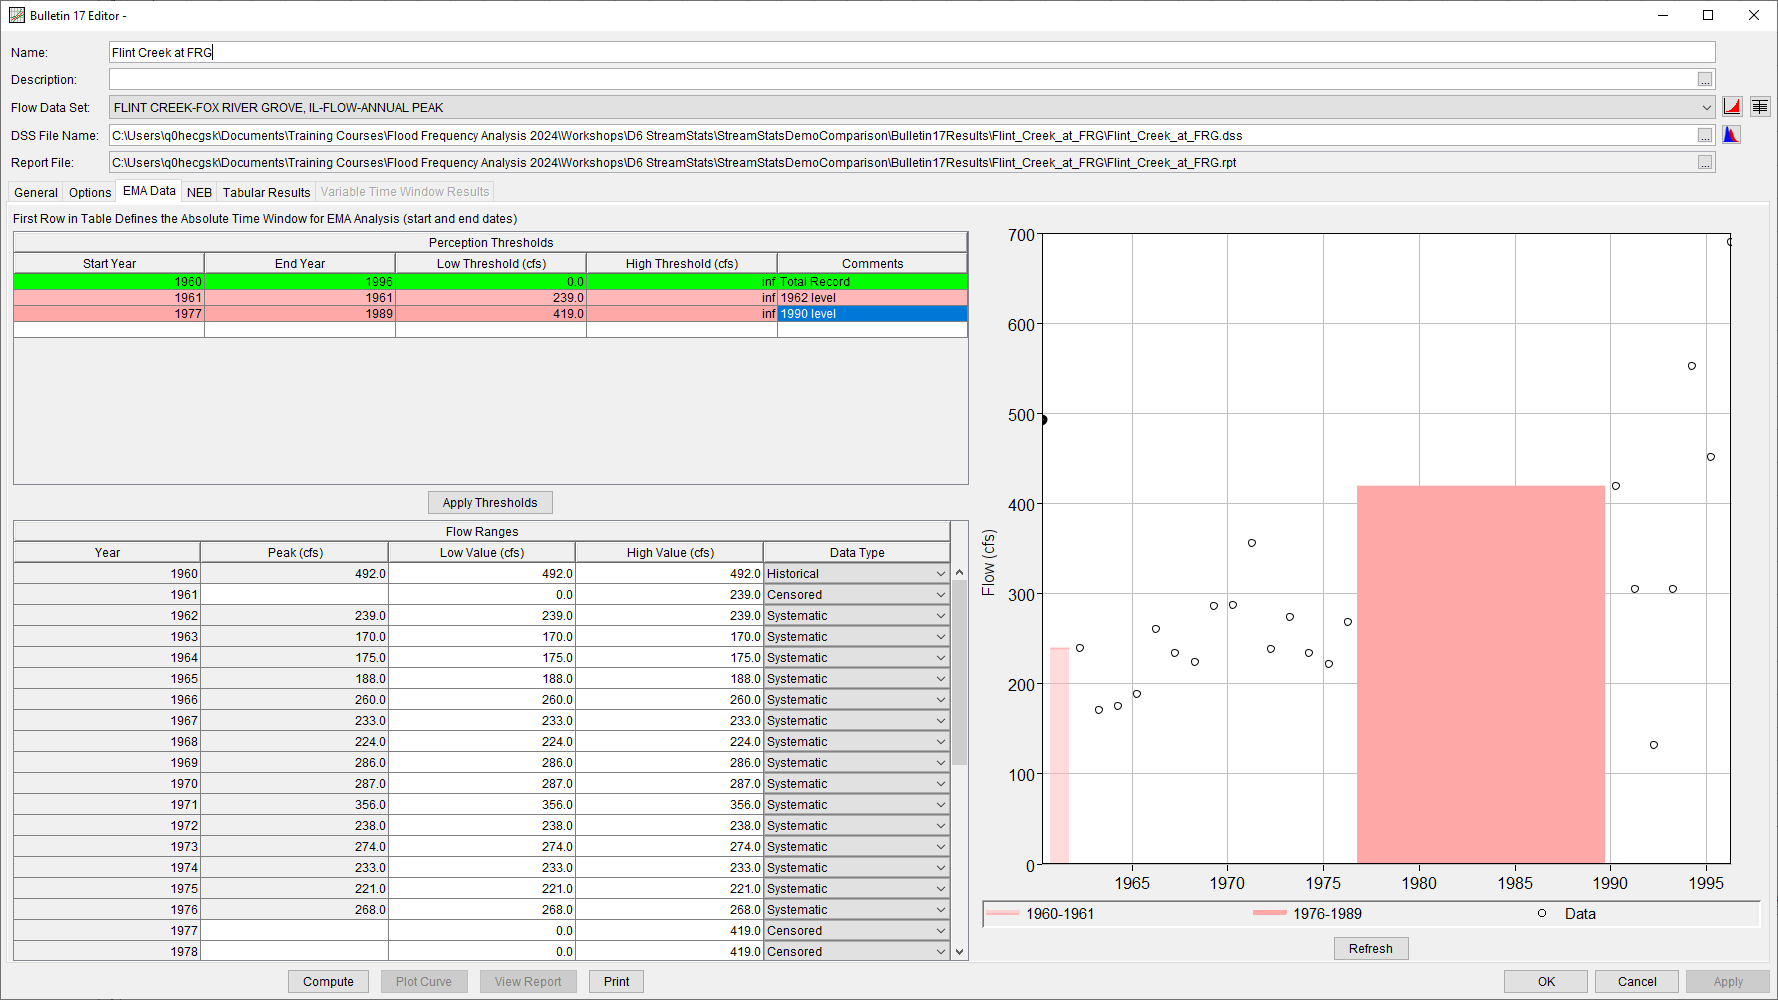
However, there is not much that can be done about the nonstationarity in these peaks. The results of the 17C/EMA analysis should be scrutinized since the observations are unlikely to be IID.
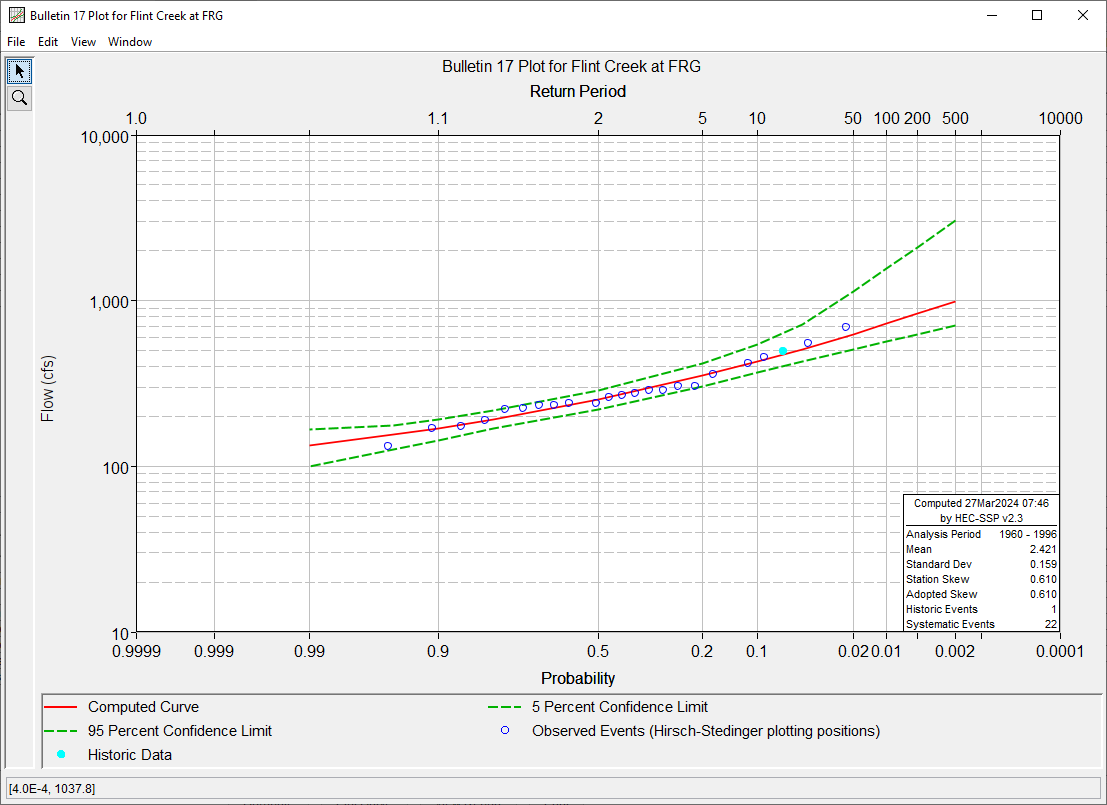
Here is the resulting frequency curve using EMA:
Comparison Between StreamStats and At-Site Quantiles
| AEP | StreamStats (cfs) | EMA (cfs) |
|---|---|---|
| 0.002 | 1920 | 994.3 |
| 0.005 | 1670 | 834.1 |
| 0.01 | 1490 | 725.8 |
| 0.02 | 1310 | 627.3 |
| 0.04 | 1150 | |
| 0.05 | 510.0 | |
| 0.1 | 927 | 429.3 |
| 0.2 | 765 | 353.5 |
| 0.5 | 537 | 254.2 |
| 0.8 | 192.7 | |
| 0.9 | 170.1 | |
| 0.95 | 154.9 | |
| 0.99 | 132.8 |

What this says to me is that the peak flow data we have at this site (the 23 years of peaks, mostly from the past, with nothing since 1996), don't do a good job of capturing the flood frequency response today. Doing a good analysis at this site will require homogenizing the flood record in some way, such as through rainfall-runoff modeling, or relying more heavily on regional estimators such as those provided by StreamStats.