Download PDF
Download page Ball Mountain Dam.
Ball Mountain Dam
Background
Summary and Purpose
This paleoflood analysis addresses the long-term flood history for Ball Mountain Dam, located along the West River upstream of Jamaica, Vermont. The analysis involved identification of geomorphic evidence of past large floods and evidence of surface stability and a lack of inundation. Geomorphic and stratigraphic evidence show that an intermediate-level terrace has not been inundated since its formation approximately 10,000 years ago. Based on 2D hydraulic modeling, the paleo discharge that would have inundated this feature is approximately 70,000 to 160,000 cfs, with a preferred estimate of 115,000 cfs. With these data, a flow-frequency analysis used the Expected Moments Algorithm (EMA) to develop a peak-inflow frequency curve for the West River near Ball Mountain Dam, which helps constrain the upper end of the unregulated instantaneous peak inflow-frequency curve and helps to inform longer duration volume frequency curves. Through use of paleoflood data, this analysis shows that the skew of the inflow-frequency curve is less than previous estimates, and the skew of inflow volume-frequency curves should be much less than previous estimates. Accordingly, the frequency with which extremely high pool stages are equaled or exceeded is expected to decrease relative to previous estimates. The results of this analysis of the West River show that incorporating paleoflood information into flow frequency analyses can improve confidence and allow for use of an inflow frequency curve based on more than a short-term, limited historic record. This analysis of the West River provides confidence that paleoflood analytical tools, originally developed and applied in western US watersheds, can be applied to watersheds in the northeastern United States.
Download a copy of the project report here: Project Report
Project Description
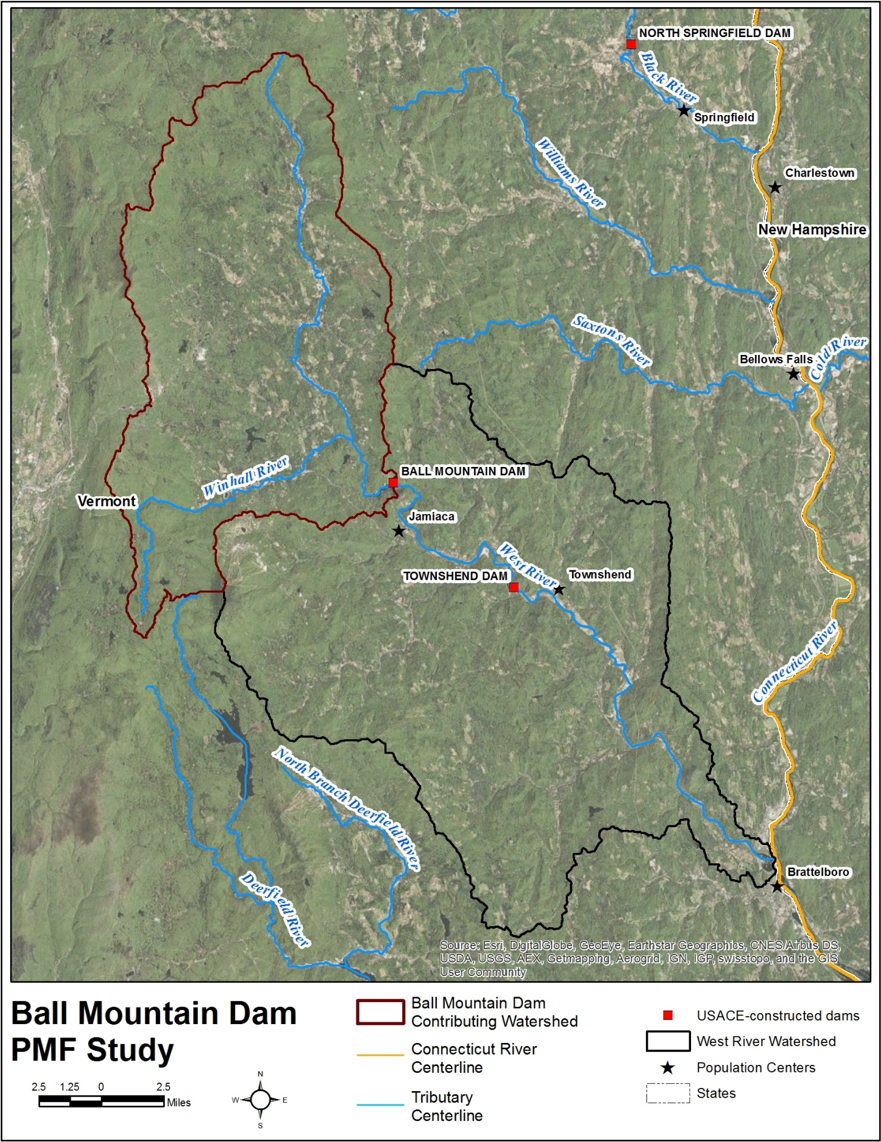
Ball Mountain Dam was constructed near the town of Jamaica, Vermont by the Corps of Engineers as a single-purpose flood control project. Construction was completed in October 1961. Ball Mountain Dam, owned and operated by the U.S. Army Corps of Engineers New England District (NAE), is located in southeastern Vermont on the West River approximately 29 miles upstream from the confluence of the West and Connecticut River, as shown in the following figure. The total drainage area for the watershed above Ball Mountain Dam is approximately 172 square miles. The watershed upstream of Ball Mountain Lake is conducive to rapid runoff due to mountainous terrain with few natural or artificial ponds. Another Corps project, Townshend Lake, is located on the West River, 9 miles downstream of Ball Mountain Lake. Together, these flood control projects are operated to reduce flood stages on the West and Connecticut Rivers (USACE 1990).
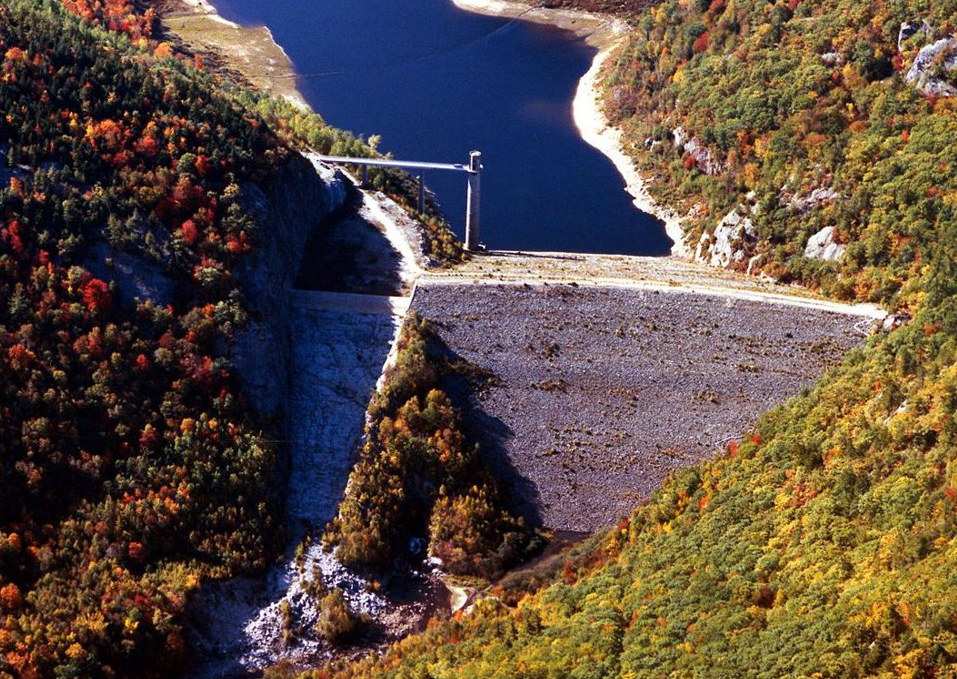
The embankment consists of a rolled earth fill dam with rock slope protection approximately 915 feet in length, with a 265 feet maximum height above the streambed, as shown in the following figure. The dam crest is at elevation 1,051.6 feet NAVD 88 and was designed to provide 30 feet of spillway surcharge plus 5 feet of freeboard (35 feet above spillway crest at elevation 1,016.6 feet NAVD 88). The top width of the embankment is 20 feet with side slopes varying from 1 on 1.75 to 1 on 2.50 (vertical:horizontal). Ball Mountain Lake’s storage capacity totals 54,450 acre-feet when filled to the spillway crest, equivalent to about 5.9 inches of runoff from the 172-square mile drainage area. The resulting pool extends approximately 6.5 miles up the West River and covers a surface area of 810 acres.
Data
Systematic Record
Construction of Ball Mountain Dam started in 1957 and closure occurred in 1961. Development of the systematic annual peak record involved:
- Pre-Dam Conditions for Historical Flood Annual Peak Inflow (prior to 1961): Annual peak information from available gages for the pre-dam timeframe was used, as well as additional information provided by the New England District. USGS gage records, rating curves, water supply reports, studies, and flow frequency reports were reviewed to verify, supplement, or extrapolate these data, or were used as criteria for inclusion or exclusion of the record.
- Post-Dam Conditions for Systematic Unregulated Annual Peak Inflow (after 1961): The period of record for unregulated daily Ball Mountain Dam inflow (i.e., WY1962-WY2015) was provided by the New England District and was developed by modeling the period of record inflow with reservoir simulation.
For WY1962-WY2015, unregulated data was developed from regulated data. For data prior to 1962, flow/stage gages with historical records downstream of the dam were considered. The systematic data included within this analysis is tabulated within the following table.
| Water Year | Flow (cfs) |
|---|---|
| 1920 | 5792 |
| 1921 | 5792 |
| 1922 | 6476 |
| 1923 | 3028 |
| 1928 | 30000 |
| 1929 | 5109 |
| 1930 | 1722 |
| 1931 | 8602 |
| 1932 | 3993 |
| 1933 | 7539 |
| 1934 | 6932 |
| 1935 | 5489 |
| 1936 | 25000 |
| 1937 | 5109 |
| 1938 | 37000 |
| 1939 | 3734 |
| 1940 | 6172 |
| 1941 | 712 |
| 1942 | 5261 |
| 1943 | 5261 |
| 1944 | 7600 |
| 1945 | 5716 |
| 1946 | 4365 |
| 1947 | 9110 |
| 1948 | 10600 |
| 1949 | 29500 |
| 1950 | 4850 |
| 1951 | 11700 |
| 1952 | 24100 |
| 1953 | 10100 |
| 1954 | 4460 |
| 1955 | 9460 |
| 1956 | 8020 |
| 1957 | 6200 |
| 1958 | 7000 |
| 1959 | 4070 |
| 1960 | 6480 |
| 1961 | 4320 |
| 1962 | 10381 |
| 1963 | 3491 |
| 1964 | 9170 |
| 1965 | 2956 |
| 1966 | 3754 |
| 1967 | 7953 |
| 1968 | 7088 |
| 1969 | 15821 |
| 1970 | 6754 |
| 1971 | 4074 |
| 1972 | 8156 |
| 1973 | 23873 |
| 1974 | 7953 |
| 1975 | 4472 |
| 1976 | 22326 |
| 1977 | 12225 |
| 1978 | 3975 |
| 1979 | 7715 |
| 1980 | 7422 |
| 1981 | 15607 |
| 1982 | 8936 |
| 1983 | 6526 |
| 1984 | 17619 |
| 1985 | 4590 |
| 1986 | 12613 |
| 1987 | 22588 |
| 1988 | 7293 |
| 1989 | 5521 |
| 1990 | 7277 |
| 1991 | 5618 |
| 1992 | 6328 |
| 1993 | 7256 |
| 1994 | 9074 |
| 1995 | 4385 |
| 1996 | 10210 |
| 1997 | 6654 |
| 1998 | 8792 |
| 1999 | 4216 |
| 2000 | 8767 |
| 2001 | 11407 |
| 2002 | 2850 |
| 2003 | 6818 |
| 2004 | 8247 |
| 2005 | 11113 |
| 2006 | 6895 |
| 2007 | 8925 |
| 2008 | 6142 |
| 2009 | 6520 |
| 2010 | 7688 |
| 2011 | 28225 |
| 2012 | 3691 |
| 2013 | 5588 |
| 2014 | 4412 |
A perception threshold of 30000 cfs was inferred for the missing period (WY1924 – WY1927). This magnitude corresponds to the approximate magnitude of the November 1927 flood event (National Weather Service Report, USGS Report). The perception thresholds used in combination with the systematic data are tabulated below.
| Start Year | End Year | Low Threshold (cfs) | High Threshold (cfs) | Comments |
|---|---|---|---|---|
| 1924 | 1927 | 30000 | inf | Broken Record less than Nov 1927 |
Historical Record
The historical record was set from 1780 to 1919 because Jamaica, VT was first settled in 1780 (Brief History of Jamaica, n.d.). In the West River Basin, there have been floods dating back to 1801. Significant flooding occurred in 1801, 1824, 1828, 1830, 1841, 1854, 1862, and 1869 (U.S. Army Corps of Engineers, 1973). In addition there were floods mentioned in 1770 and 1785 in the area. However, there are no records with respect to stage or discharge.
A perception threshold of 40000 cfs was inferred for the historical period (WY1780 – WY1919). This magnitude is slightly larger than the largest flow on record (i.e. 30000 cfs from the November 1927 flood event). The perception thresholds used in combination with the historical data are tabulated below.
| Start Year | End Year | Low Threshold (cfs) | High Threshold (cfs) | Comments |
|---|---|---|---|---|
| 1780 | 1919 | 40000 | inf | Historical Record |
Paleoflood
Evidence of historic and pre-historic flooding can be provided by flood-related riverine deposits, which are termed Paleostage Indictors (PSI), and/or deposits and landforms that demonstrate an absence of inundation over recent geologic time, which are referred to as Non-Exceedance Bounds (NEB). Near Ball Mountain Dam, geomorphic and stratigraphic evidence show that an intermediate-level terrace has not been inundated since its formation approximately 10,000 years ago. This feature was classified as an NEB. Based on 2D hydraulic modeling, the paleo discharge that would have inundated this feature is approximately 70,000 to 160,000 cfs, with a preferred estimate of 115,000 cfs.
A perception threshold of 160000 cfs was inferred for the paleoflood period (WY-7985 – WY1919). Year -7985 corresponds to a date 10,000 years prior to the completion of this paleoflood study. The perception thresholds used in combination with the paleoflood data are tabulated below.
| Start Year | End Year | Low Threshold (cfs) | High Threshold (cfs) | Comments |
|---|---|---|---|---|
| -7985 | 1779 | 160000 | inf | Terrace Qty1 (9,000 to 11,000 year record) |
Bulletin 17 Analysis
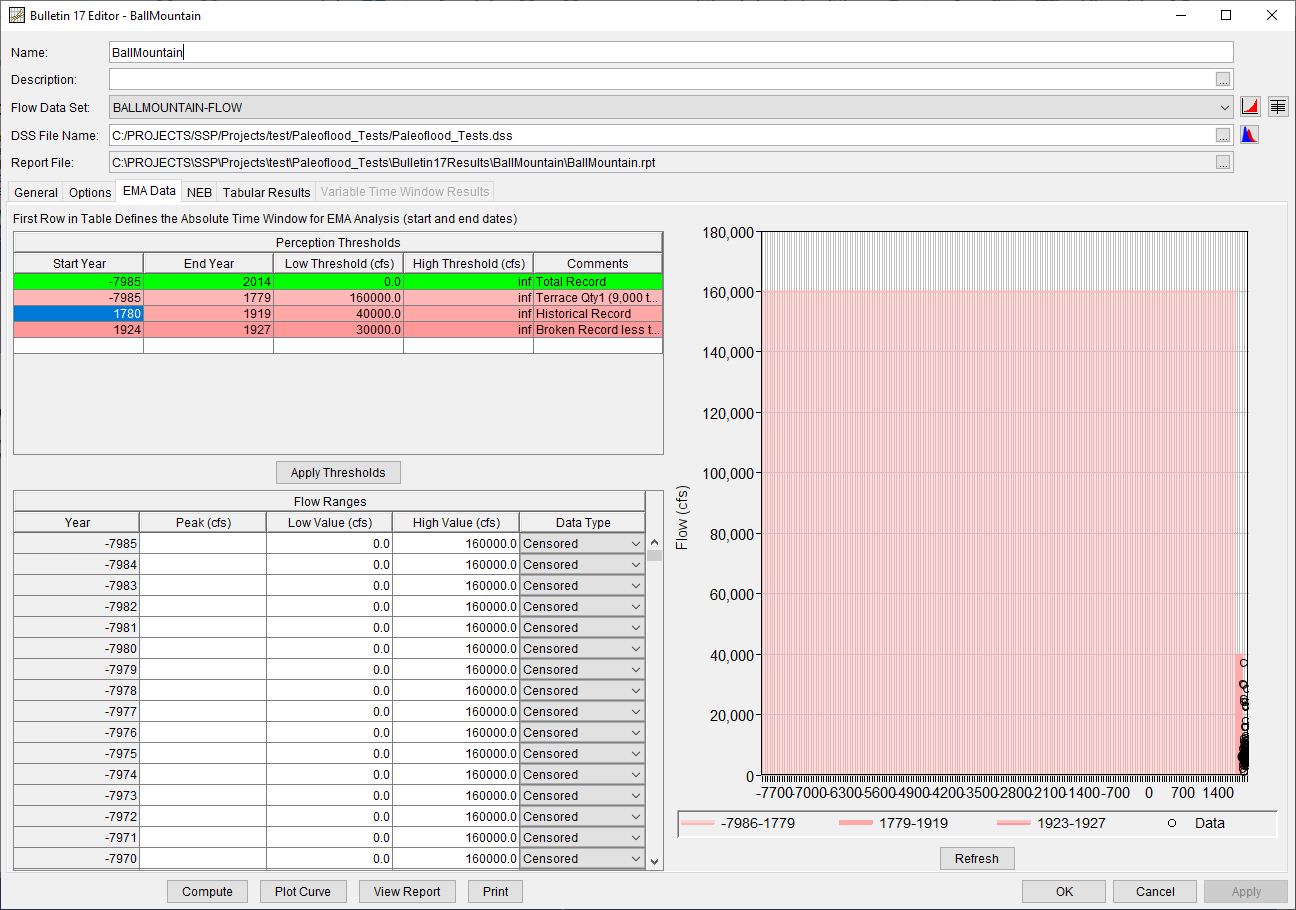
A Bulletin 17 Analysis using Bulletin 17C procedures has been developed for this example. To open the analysis, either double-click on the analysis labeled "BallMountain" from the Study Explorer or from the Analysis menu select open, then select "BallMountain" from the list of available analyses. The previously-mentioned systematic, historical, and paleoflood data was entered within the EMA Data tab, as shown within the following figure.
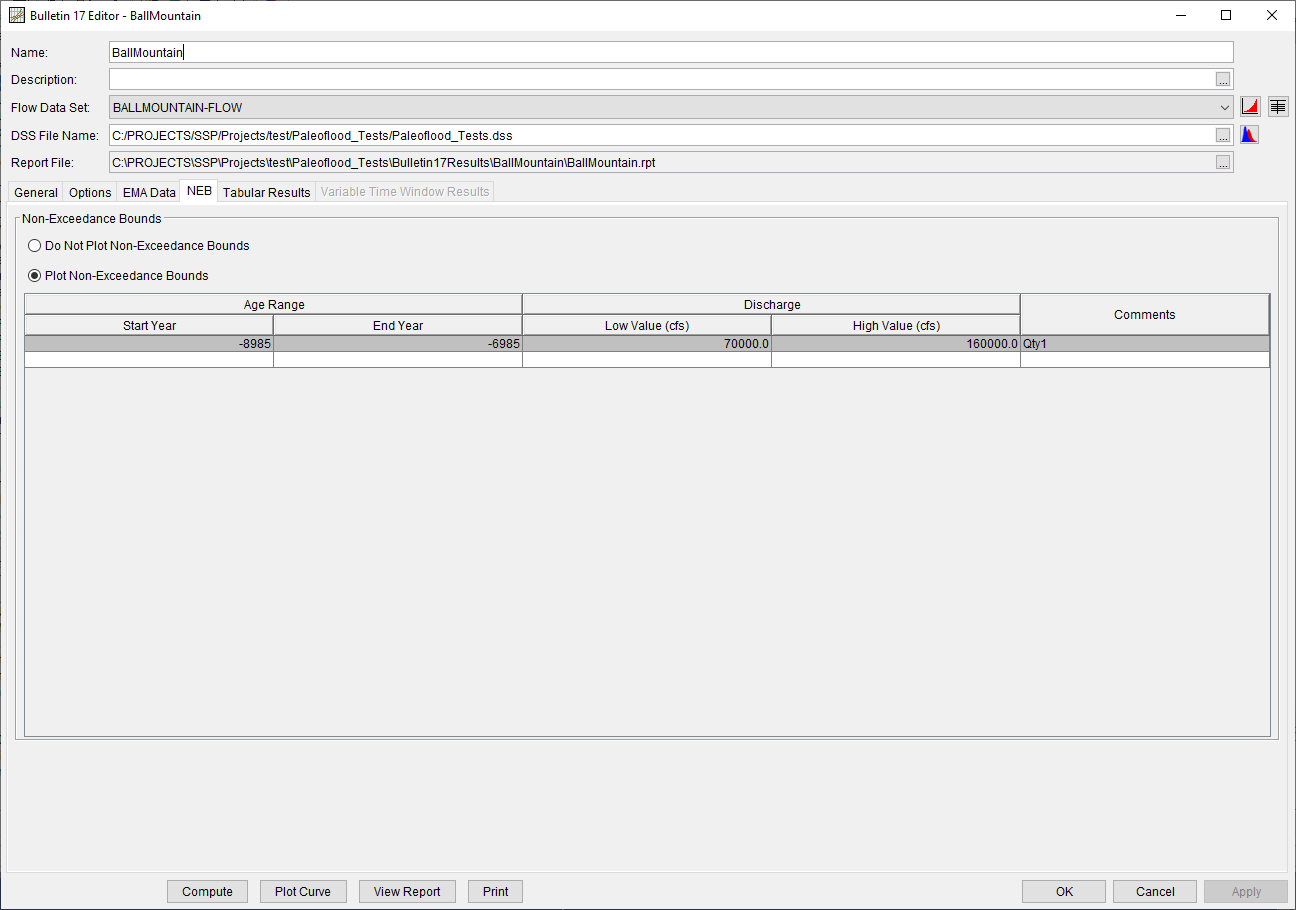
An NEB corresponding to the paleoflood data was entered on the NEB tab, as shown in the following figure. The Start and End Year correspond to an estimated age range of 11000 to 9000 years. The Low and High Value correspond to the estimated discharge ranges.
Results
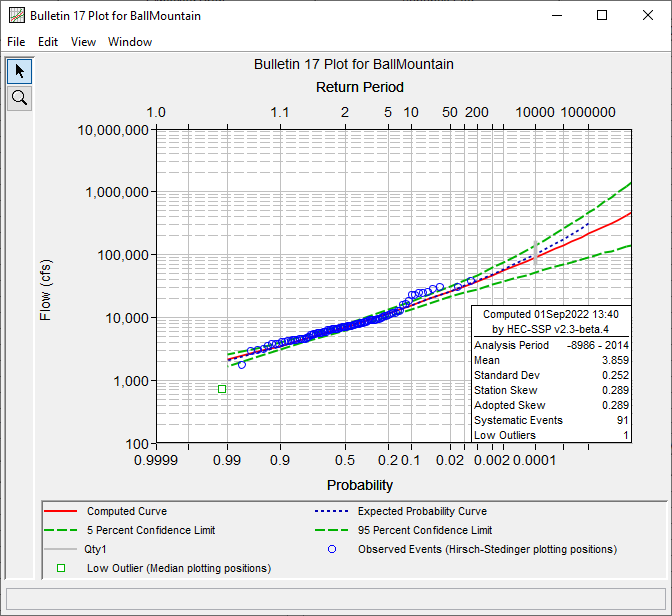
A plot summarizing the computed results is shown within the following figure.
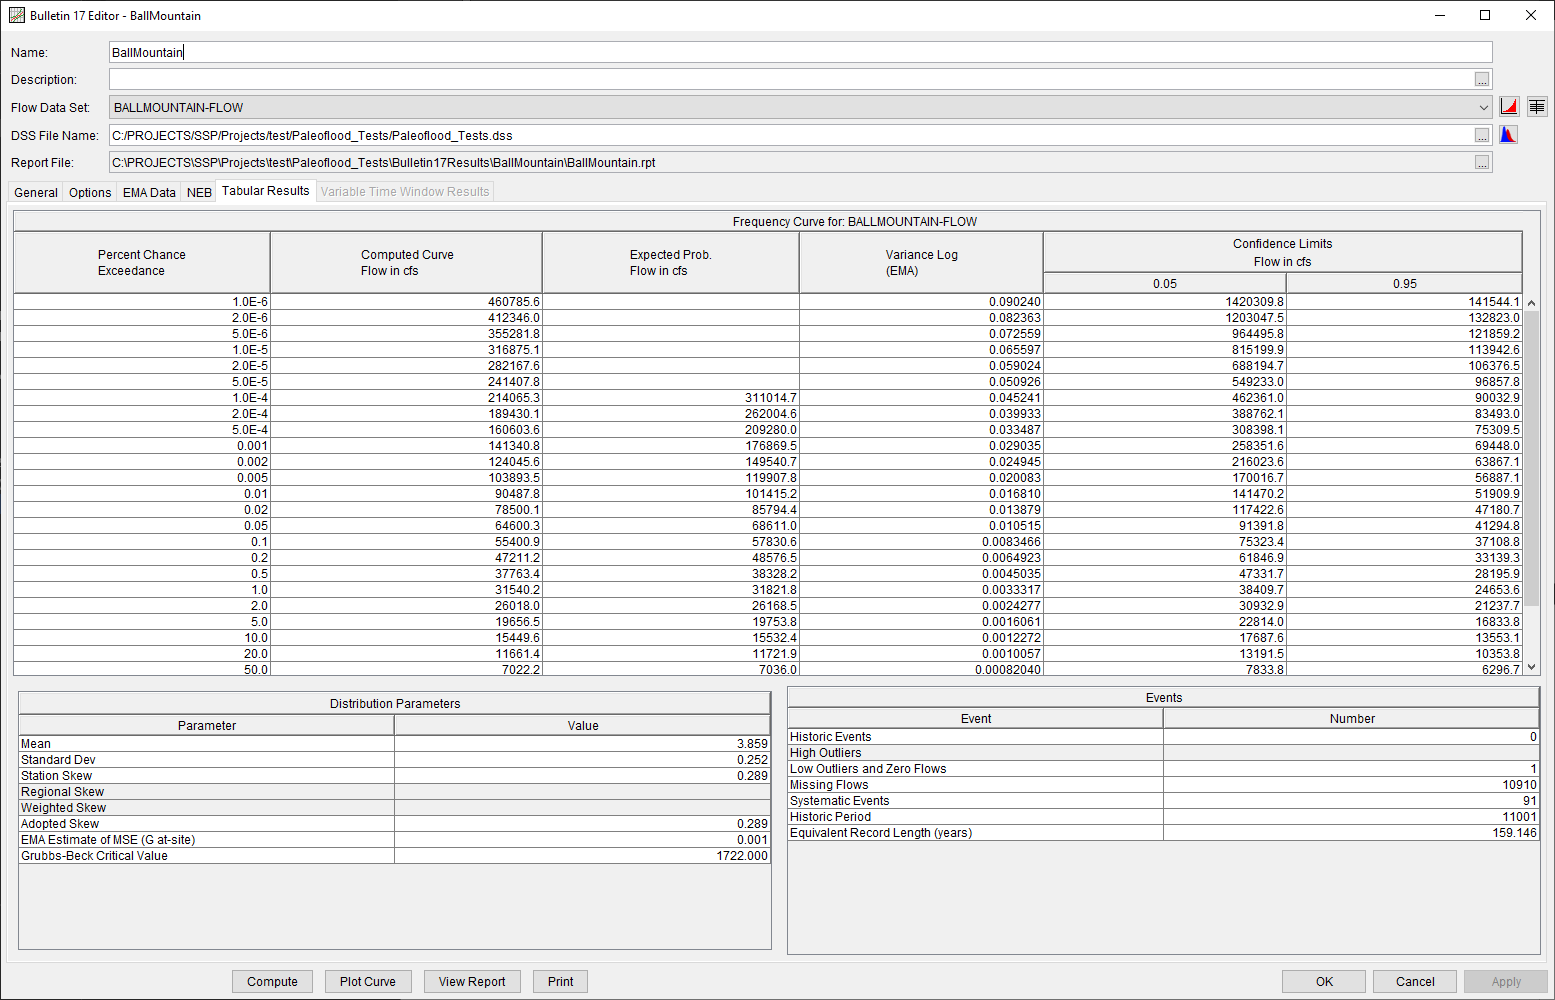
The Tabular Results tab is shown within the following figure.
