Download PDF
Download page Carbon Canyon Dam.
Carbon Canyon Dam
Background
Summary and Purpose
This paleoflood analysis is a collaborative effort among geologic, geomorphic, hydrologic, hydraulic, and statistical disciplines to estimate the magnitudes and frequencies of large floods in Carbon Canyon Wash upstream of Carbon Canyon Dam. This dam provides flood control for the cities of Brea, Yorba Linda, and other cities in Orange County, California. The goal of this work is to improve the characterization of long-term hydrologic loading based on systematic (gaged) and historic flood records coupled with paleoflood information. The analysis provides evidence of geomorphic features and stratigraphic deposits that were formed during large floods during the past two thousand years, estimates paleodischarges associated with these features, and applies this information to standard flow-frequency analyses. This paleoflood analysis provides information on two large pre-historic floods in the watershed upstream of Carbon Canyon Dam during the past approximately two thousand years.
Project Description
Carbon Canyon Dam is located on Carbon Canyon Creek in the city of Brea, California, and is adjacent to the town of Yorba Linda in northern Orange County. The drainage area served by the facility is 19.3 square miles, from the Puente and Chino Hills that are directly north and east of the dam. Carbon Canyon Creek flows in a southwesterly direction onto the Orange County coastal plain, joins Coyote Creek, and then flows into the San Gabriel River. The primary purpose of the facility is flood risk management in the Carbon Canyon Creek drainage basin. In conjunction with Brea and Fullerton Dams, Carbon Canyon Dam reduces flooding risks to portions of the coastal basins in Orange County, including residential, commercial, and industrial properties in the cities of Brea, Yorba Linda, Placentia, Fullerton, and Anaheim. Carbon Canyon Dam was constructed from 1959 to 1961.
Data
Systematic Record
The systematic record of instantaneous peak inflows spanning water year (WY) 1932 to WY 2014 was provided by the Los Angeles District Reservoir Regulation section. A missing period spanning WY 1937 - WY 1950 is present.
| Water Year | Flow (cfs) |
|---|---|
| 1932 | 273 |
| 1933 | 182 |
| 1934 | 713 |
| 1935 | 100 |
| 1936 | 323 |
| 1951 | 2 |
| 1952 | 591 |
| 1953 | 24 |
| 1954 | 173 |
| 1955 | 88 |
| 1956 | 149 |
| 1957 | 21 |
| 1958 | 898 |
| 1959 | 31 |
| 1960 | 48 |
| 1961 | 8 |
| 1962 | 96 |
| 1963 | 35 |
| 1964 | 34 |
| 1965 | 85 |
| 1966 | 126 |
| 1967 | 359 |
| 1968 | 584 |
| 1969 | 1632 |
| 1970 | 96 |
| 1971 | 69 |
| 1972 | 58 |
| 1973 | 169 |
| 1974 | 98 |
| 1975 | 125 |
| 1976 | 116 |
| 1977 | 87 |
| 1978 | 1033 |
| 1979 | 647 |
| 1980 | 1117 |
| 1981 | 1199 |
| 1982 | 1559 |
| 1983 | 1731 |
| 1984 | 72 |
| 1985 | 67 |
| 1986 | 1146 |
| 1987 | 409 |
| 1988 | 4 |
| 1989 | 445 |
| 1990 | 62 |
| 1991 | 1611 |
| 1992 | 2430 |
| 1993 | 2392 |
| 1994 | 5 |
| 1995 | 1309 |
| 1996 | 847 |
| 1997 | 793 |
| 1998 | 768 |
| 1999 | 67 |
| 2000 | 69 |
| 2001 | 157 |
| 2002 | 4 |
| 2003 | 325 |
| 2004 | 233 |
| 2005 | 2062 |
| 2006 | 40 |
| 2007 | 1 |
| 2008 | 205.5 |
| 2009 | 2699.6 |
| 2010 | 1575.9 |
| 2011 | 968.6 |
| 2012 | 69.4 |
| 2013 | 0.1 |
| 2014 | 187 |
A perception threshold of 3500 cfs was inferred for the missing period (WY1937 – WY1950). The perception thresholds used in combination with the systematic data are tabulated below.
| Start Year | End Year | Low Threshold (cfs) | High Threshold (cfs) | Comments |
|---|---|---|---|---|
| 1937 | 1950 | 3500 | inf | Missing systematic |
Historical Record
Storms and floods of 1938 brought severe flooding to Southern California. The March 1938 storm event was centered in the San Bernardino and San Gabriel Mountains and produced the flood of record for many locations in Southern California including Carbon Canyon. A calibrated and validated HEC-HMS model was used to estimate the WY 1938 peak discharge. A range between 3,500 and 9,000 cfs was inferred from the available data.
A series of devastating storms produced extreme precipitation over much of the western U.S. starting in December 1861 and lasting through January 1862. During this time, over 35 inches of precipitation was recorded in Los Angeles (National Weather Service, 2017). Evidence collected during site investigations in addition to newspaper reports was used to deduce that the WY 1862 flood was the largest since WY 1938. Therefore, a perception threshold of 9000 cfs was inferred for the period spanning WY 1862 – WY 1931. The perception threshold used in combination with the historical data is tabulated below.
| Start Year | End Year | Low Threshold (cfs) | High Threshold (cfs) | Comments |
|---|---|---|---|---|
| 1862 | 1931 | 9000 | inf | Historical Record |
Paleoflood
Sediment deposits were interpreted to be a result of high flood discharge (i.e. PSI) with an age range of 150 and 500 years ago with a best estimate age of 335 years old. The magnitude of the paleoflood PSI ranged from 14000 cfs to 43000 cfs with a best estimate of 29000 cfs.
Additionally, an NEB was identified from additional sediment deposits and dated as approximately 1,800 years old. The magnitude of the NEB was estimated to be 86000 cfs.
The perception thresholds used in combination with the paleoflood data are tabulated below.
| Start Year | End Year | Low Threshold (cfs) | High Threshold (cfs) | Comments |
|---|---|---|---|---|
| 215 | 1679 | 86000 | inf | Ht1 NEB |
| 1681 | 1861 | 29000 | inf | Ht2 PSI |
Bulletin 17 Analysis
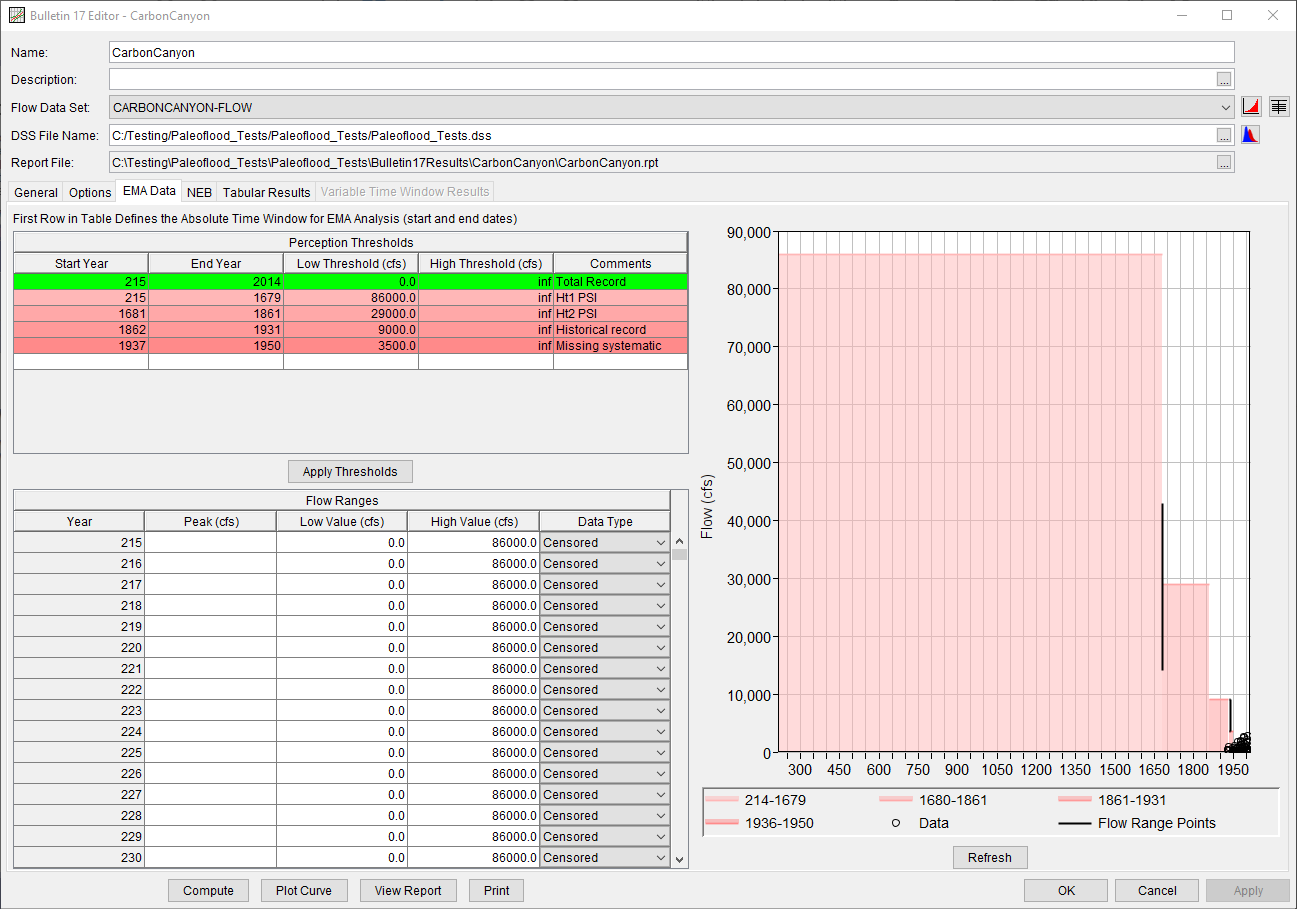
A Bulletin 17 Analysis using Bulletin 17C procedures has been developed for this example. To open the analysis, either double-click on the analysis labeled "CarbonCanyon from the Study Explorer or from the Analysis menu select open, then select "CarbonCanyon" from the list of available analyses. The previously-mentioned systematic, historical, and paleoflood data was entered within the EMA Data tab, as shown within the following figure.

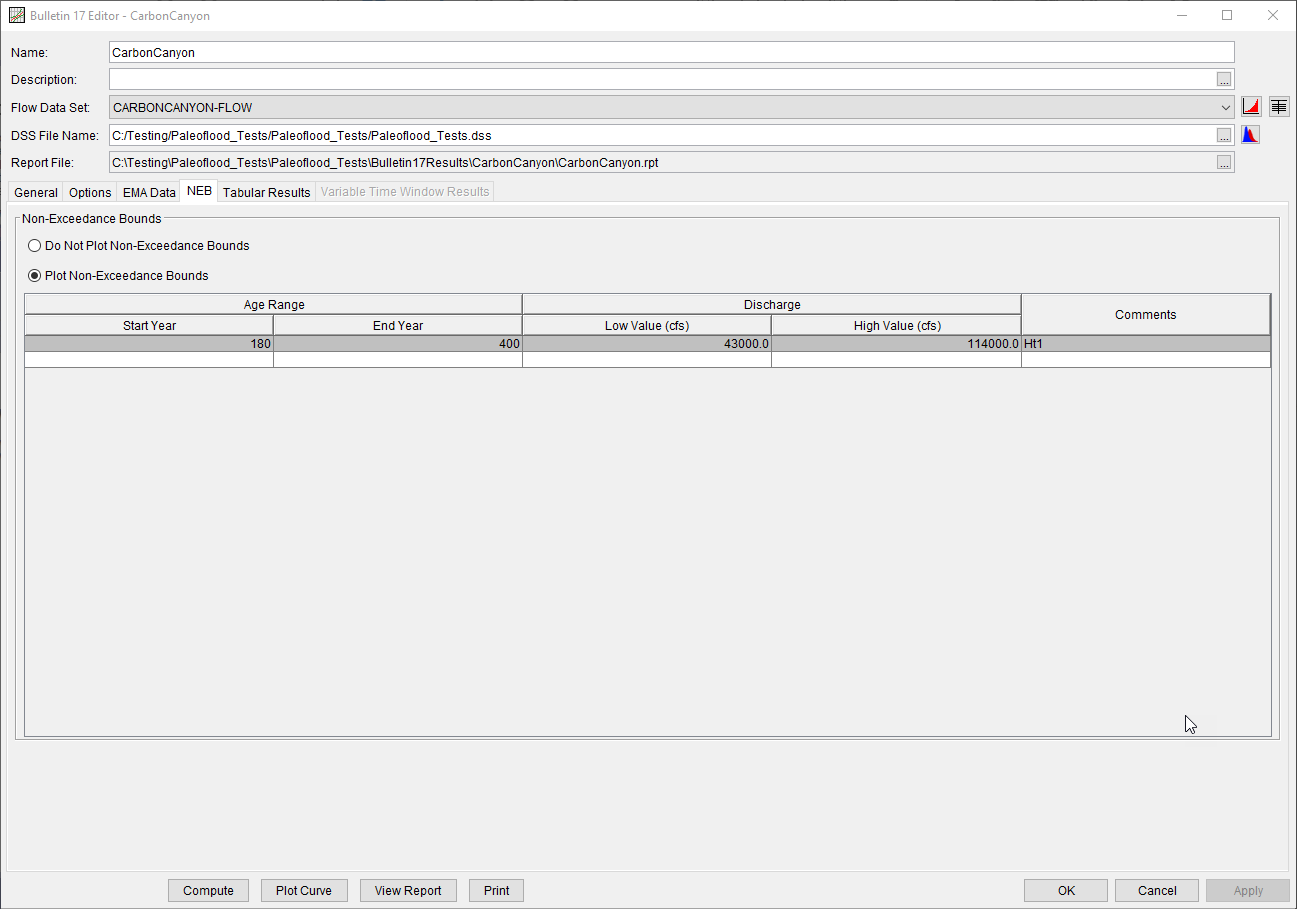
An NEB corresponding to the paleoflood data was entered on the NEB tab, as shown in the following figure. The Start and End Year correspond to an estimated age range of 1834 to 1614 years. The Low and High Value correspond to the estimated discharge ranges.

Results
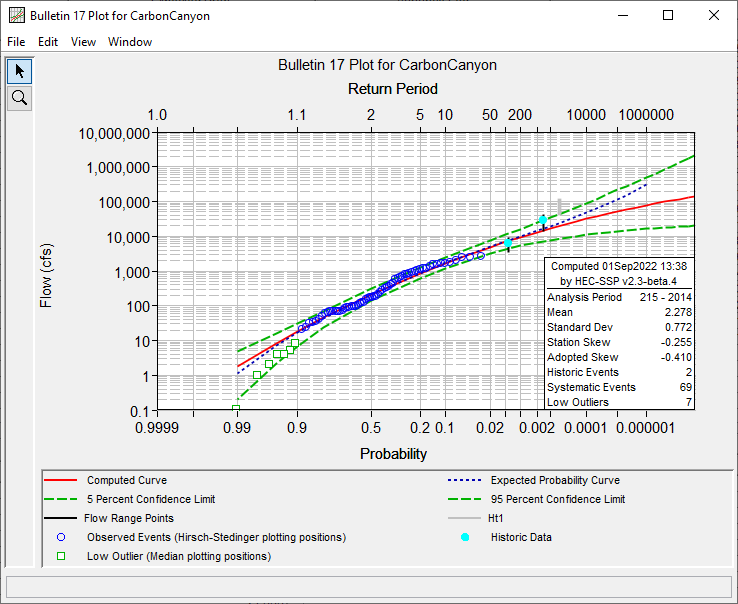
A plot summarizing the computed results is shown within the following figure.

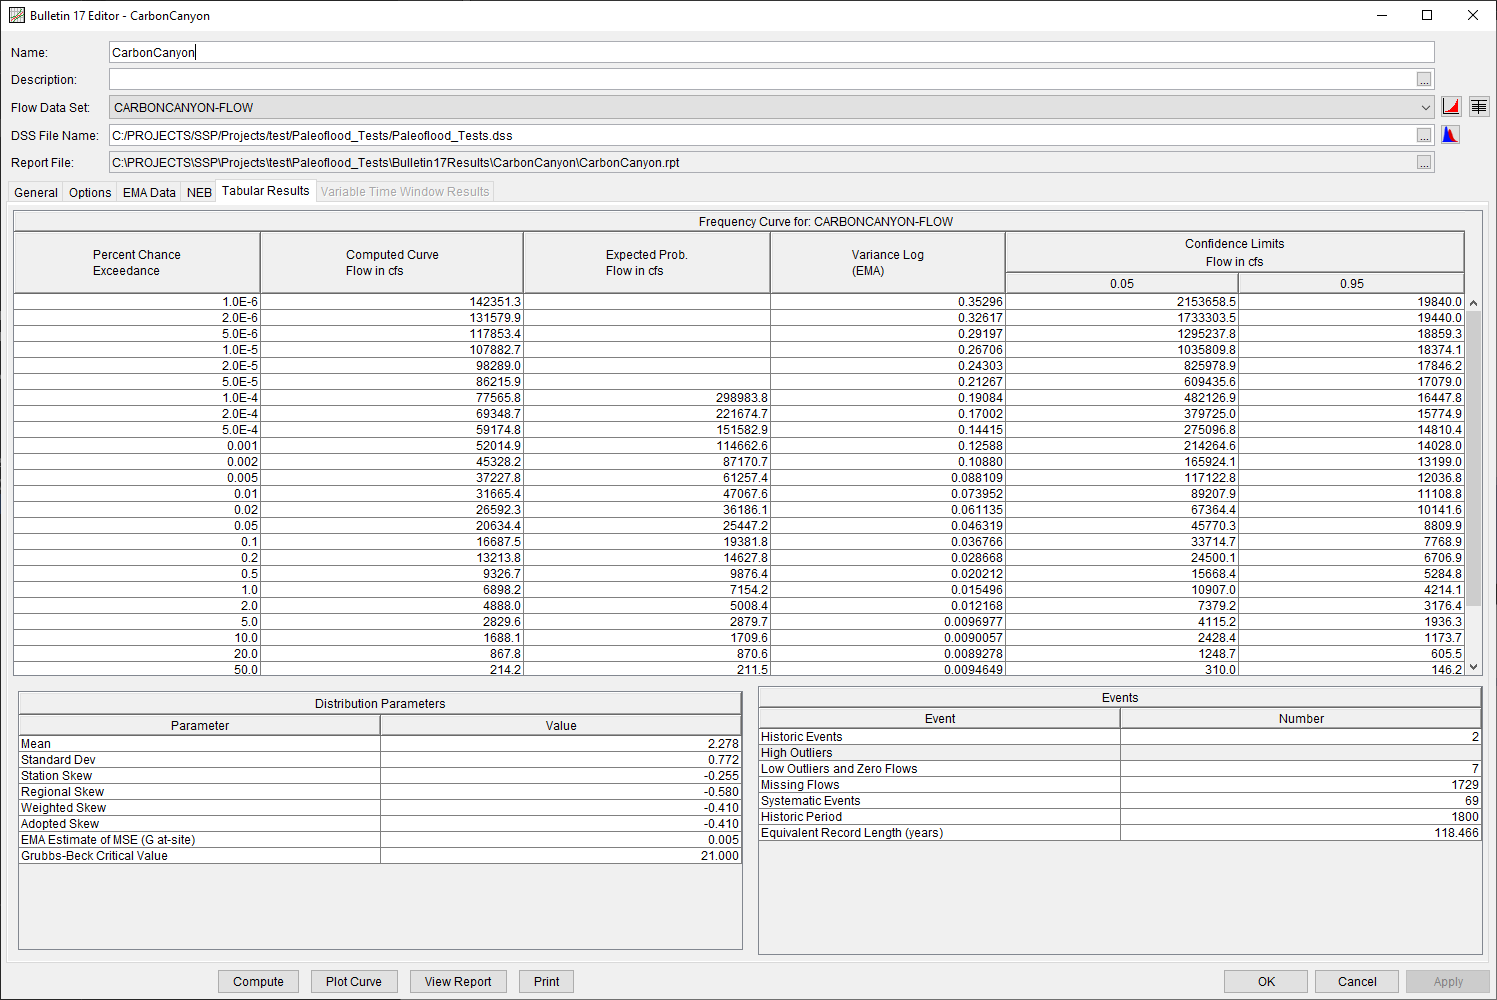
The Tabular Results tab is shown within the following figure.
