Download PDF
Download page Garrison Dam.
Garrison Dam
Background
Summary and Purpose
This initial, pilot-level paleoflood analysis provides information on pre-historic large discharges along the upper Missouri River near Garrison Dam, and helps reduce the level of uncertainty in extrapolations of hydrologic loading to infrequent annual exceedance probabilities. The analysis provides two additional data points for constraining the upper end of the unregulated inflow-frequency curve for the upper Missouri River near Garrison Dam. Prior to the historical and instrumental record, the Missouri River watershed upstream of Stanton, ND produced at least one large discharge that was greater than the flood of record (in the spring of 1952). In the area downstream of Garrison Dam, multiple fluvial deposits and associated terraces record a history of flooding over the past few thousand years.
Project Description
The Garrison Dam – Lake Sakakawea Project is a multiple purpose project consisting of a rolled earthfill dam, a hydroelectric generating plant and a reservoir. The Garrison Dam crest elevation of the embankment is at 1875 feet and impounds Lake Sakakawea with a gross storage of approximately 23,451,000 acre-feet at elevation 1854 feet LPD as of 2010-2012 survey data (MRBWM, 2018). It is ranked as the largest Corps reservoir and the third largest reservoir in the United States. Lake Sakakawea has approximately 1,340 miles of shoreline at elevation 1837.5 feet, and the length of the reservoir extends for 178 miles along the valley of the Missouri River.

Garrison Dam is the second-most upstream dam along the Missouri River mainstem system of dams and reservoirs operated by the U.S. Army Corps of Engineers (USACE) for flood control, navigation, hydropower, irrigation, water supply, recreation, fish and wildlife, and water quality purposes, as shown below. The drainage basin for Garrison Dam covers approximately 124,000 square miles which does not include the upstream Fort Peck Dam drainage area (USACE, 2006) of 57,500 square miles.
")
Data
Systematic Description
For the period 1930-1951 the systematic unregulated flow estimates are based upon gage discharge estimates from the Williston, Elbowoods, and Bismarck gages. The period of record for unregulated daily Garrison Dam inflow (i.e., WY1953-WY2015) was provided by the Omaha District and was developed by modeling the period of record inflow with reservoir simulation.
| Water Year | Peak (cfs) |
|---|---|
| 1930 | 77700 |
| 1931 | 74400 |
| 1932 | 134700 |
| 1933 | 127100 |
| 1934 | 64300 |
| 1935 | 130200 |
| 1936 | 89700 |
| 1937 | 110700 |
| 1938 | 146000 |
| 1939 | 86200 |
| 1940 | 85900 |
| 1941 | 86400 |
| 1942 | 143400 |
| 1943 | 174800 |
| 1944 | 155100 |
| 1945 | 108300 |
| 1946 | 92100 |
| 1947 | 134100 |
| 1948 | 144300 |
| 1949 | 103200 |
| 1950 | 122300 |
| 1951 | 97400 |
| 1952 | 122600 |
| 1953 | 223700 |
| 1954 | 91200 |
| 1955 | 108000 |
| 1956 | 161000 |
| 1957 | 138400 |
| 1958 | 121800 |
| 1959 | 137200 |
| 1960 | 87300 |
| 1961 | 108300 |
| 1962 | 145500 |
| 1963 | 138600 |
| 1964 | 228400 |
| 1965 | 168200 |
| 1966 | 74400 |
| 1967 | 221100 |
| 1968 | 157700 |
| 1969 | 134200 |
| 1970 | 169300 |
| 1971 | 170100 |
| 1972 | 187200 |
| 1973 | 103700 |
| 1974 | 192200 |
| 1975 | 217500 |
| 1976 | 126700 |
| 1977 | 84700 |
| 1978 | 163400 |
| 1979 | 113400 |
| 1980 | 112200 |
| 1981 | 162700 |
| 1982 | 166100 |
| 1983 | 117900 |
| 1984 | 124400 |
| 1985 | 86000 |
| 1986 | 162400 |
| 1987 | 74400 |
| 1988 | 84300 |
| 1989 | 101800 |
| 1990 | 97800 |
| 1991 | 153700 |
| 1992 | 88100 |
| 1993 | 102300 |
| 1994 | 92500 |
| 1995 | 174100 |
| 1996 | 181300 |
| 1997 | 223100 |
| 1998 | 130700 |
| 1999 | 135600 |
| 2000 | 90900 |
| 2001 | 69900 |
| 2002 | 104300 |
| 2003 | 120400 |
| 2004 | 72900 |
| 2005 | 147000 |
| 2006 | 103800 |
| 2007 | 117900 |
| 2008 | 155400 |
| 2009 | 130900 |
| 2010 | 156200 |
| 2011 | 261900 |
| 2012 | 109900 |
| 2013 | 139200 |
| 2014 | 154500 |
| 2015 | 140600 |
| 2016 | 103600 |
| 2017 | 142200 |
Historical Record
For the period spanning 1881 to 1928, the annual maximum flow was estimated and reported in flow sheets developed by P.V. Hodges (U.S. Army Corps of Engineers (USACE) (P.V.Hodges)).
| Water Year | Peak (cfs) | Low (cfs) | High (cfs) |
|---|---|---|---|
| 1881 | 156700 | 133000 | 180000 |
| 1882 | 144000 | 122000 | 166000 |
| 1886 | 119700 | 102000 | 138000 |
| 1887 | 168400 | 143000 | 194000 |
| 1888 | 181000 | 154000 | 208000 |
| 1891 | 133300 | 113000 | 153000 |
| 1892 | 151800 | 129000 | 175000 |
| 1893 | 121700 | 103000 | 140000 |
| 1894 | 154700 | 131000 | 178000 |
| 1896 | 124600 | 106000 | 143000 |
| 1898 | 159900 | 159900 | 159900 |
| 1899 | 137900 | 137900 | 137900 |
| 1900 | 116900 | 116900 | 116900 |
| 1901 | 144900 | 144900 | 144900 |
| 1902 | 93600 | 93600 | 93600 |
| 1903 | 106200 | 106200 | 106200 |
| 1904 | 126900 | 126900 | 126900 |
| 1905 | 191100 | 191100 | 191100 |
| 1906 | 183800 | 183800 | 183800 |
| 1907 | 148600 | 148600 | 148600 |
| 1908 | 196000 | 196000 | 196000 |
| 1909 | 199300 | 199300 | 199300 |
| 1910 | 92000 | 92000 | 92000 |
| 1911 | 117800 | 117800 | 117800 |
| 1912 | 159900 | 159900 | 159900 |
| 1913 | 124700 | 124700 | 124700 |
| 1914 | 128800 | 128800 | 128800 |
| 1915 | 153200 | 153200 | 153200 |
| 1916 | 150600 | 150600 | 150600 |
| 1917 | 142400 | 142400 | 142400 |
| 1918 | 181900 | 181900 | 181900 |
| 1919 | 65100 | 65100 | 65100 |
| 1920 | 191500 | 191500 | 191500 |
| 1921 | 187000 | 187000 | 187000 |
| 1922 | 143900 | 143900 | 143900 |
| 1923 | 144000 | 144000 | 144000 |
| 1924 | 126400 | 126400 | 126400 |
| 1925 | 167400 | 167400 | 167400 |
| 1926 | 102800 | 102800 | 102800 |
| 1927 | 218900 | 218900 | 218900 |
| 1928 | 164900 | 164900 | 164900 |
The perception thresholds used in combination with the historical data are tabulated below.
| Start Year | End Year | Low Threshold (cfs) | High Threshold (cfs) | Comments |
|---|---|---|---|---|
| 1881 | 1897 | 120,000 | inf | Historical Record |
Paleo-flood Data
A PSI was included with a flow range spanning 200,000 to 400,000 cfs, with a preferred estimate of 300,000 cfs. The age of this PSI was approximately 450 years old. Two perception thresholds were inferred for the paleoflood period (WY-2495 – WY1880). The perception thresholds used in combination with the paleoflood data are tabulated below.
| Start Year | End Year | Low Threshold (cfs) | High Threshold (cfs) | Comments |
|---|---|---|---|---|
| -2495 | 1564 | 500,000 | inf | NEB Terrace Qt2 (NEB) |
| 1565 | 1880 | 300,000 | inf | PSI Terrace Qt1 |
Bulletin 17 Analysis
{ A Bulletin 17 Analysis using Bulletin 17C procedures has been developed for this example. To open the analysis, either double-click on the analysis labeled "Garrison" from the Study Explorer or from the Analysis menu select open, then select "Garrison" from the list of available analyses. The previously-mentioned systematic, historical, and paleoflood data was entered within the EMA Data tab, as shown within the following figure. }

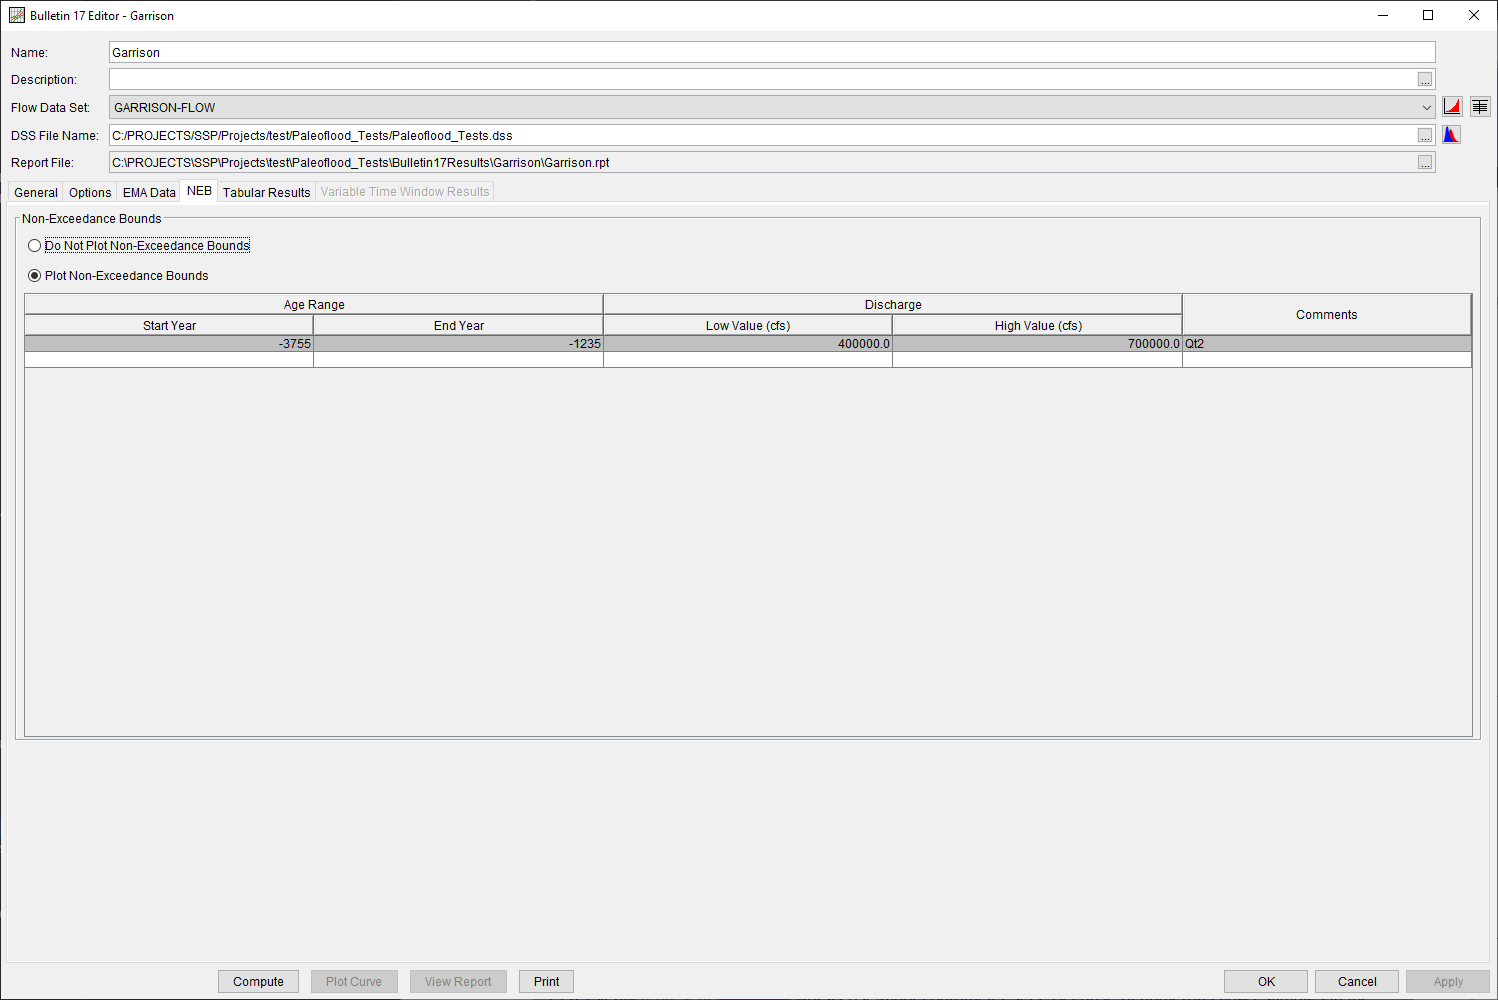
An NEB corresponding to the paleoflood data was entered on the NEB tab, as shown in the following figure.
Results
A plot summarizing the computed results is shown within the following figure.

The Tabular Results tab is shown within the following figure.
