Download PDF
Download page Lookout Point Dam.
Lookout Point Dam
Background
Summary and Purpose
This paleoflood analysis provides geologic and hydrologic on large historic and pre-historic discharges along the Middle Fork Willamette River near Lookout Point Dam, located upstream of Lowell, Oregon. This analysis provides unregulated peak inflow-frequency curves, with associated uncertainties, and helps characterize the long-term hydrologic record for reservoir loading. The work was completed through a collaborative effort among geologic, geomorphic, hydraulic, and hydrologic disciplines using standard or state-of-science methods. The field analysis yielded physical evidence of a high riverine terrace showing that during the past 2,200 to 2,400 years, there has not been a flood with a discharge of about 400,000 cfs (with a range of 280,000 to 500,000 cfs). A lower, inset terrace demonstrates the occurrence of a prehistoric flood about 370 years ago (with a range of 200 to 500 years), having a discharge of approximately 160,000 cfs (with a range of 120,000 to 200,000 cfs). Geomorphic mapping and hydraulic modeling also identify a low terrace that probably represents the historic December 1861 flood (87,000 cfs).
The paleodischarges were calculated through development of a 2D HEC-RAS computational mesh that captures key topographic features, and included a sensitivity analysis incorporating a suite of channel roughness and channel geometry cases. The hydrologic record includes an 85-year-long systematic record from nearby USGS gages, and the historic record dating from 1813. The record was adjusted to account for upstream regulation by Hills Creek Dam, and includes a total of eight large historic floods. The historic and systematic records were merged with the paleoflood discharge information to develop a peak unregulated inflow frequency curve for Lookout Point Reservoir.
Inclusion of paleoflood information to the peak unregulated inflow frequency curve significantly extends the time period covered by systematic and historical records. Overall, peak unregulated inflow frequency curves calculated using the paleoflood data yield higher discharges (by approximately 11% to 26%) at AEP levels ranging from 1/100 to 1/10,000 when compared to curves based on systematic and historic records. The data suggest that large floods have been more frequent than previously calculated based only on the historic and systematic records.
Download a copy of the project report here: Project Report
Project Description
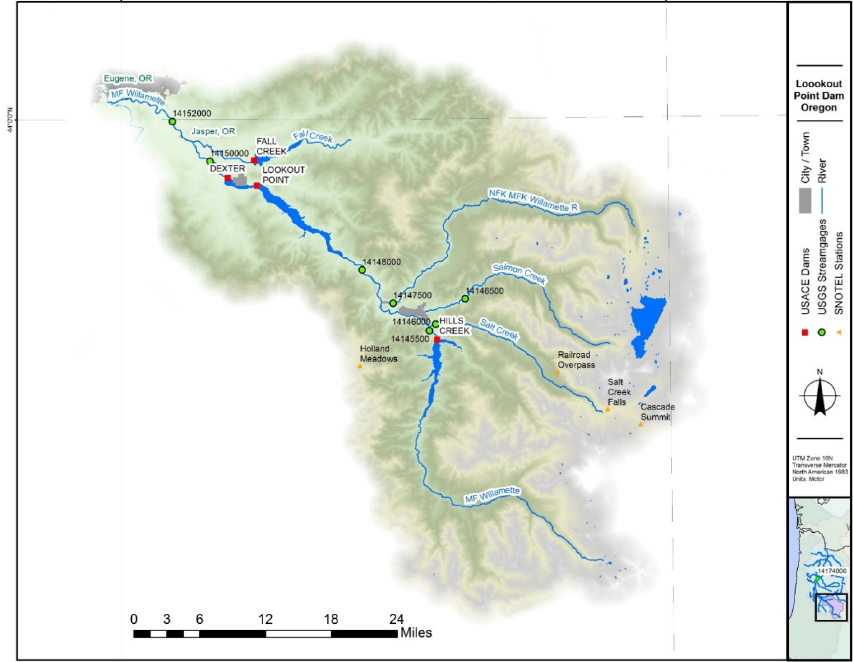
Lookout Point Dam impounds the Middle Fork Willamette River (MFWR) upstream of the town of Lowell, Lane County, Oregon as shown in the figure below. The drainage area above Lookout Point Dam is 991 square miles, with an approximate maximum length of 52 miles and maximum width of 43 miles. The MFWR flows in a northwesterly direction from its source to the confluence with the Coast Fork of the Willamette River, which is approximately fifteen river miles downstream of Lookout Point Dam. The Lookout Point drainage area has been regulated since the completion of the upstream Hills Creek Dam in 1962.
Lookout Point Dam was completed in 1953 and consists of earth fill with rock slope protection approximately 3,175 feet long, with a maximum height of 249 feet above the streambed and a dam crest elevation of 941 feet (NGVD29 datum). The controlled concrete spillway is approximately 274 feet wide and has a crest elevation of 887.5 feet. The storage capacity of Lookout Point Reservoir is 477,700 acre-feet, with a resulting pool that extends approximately 11 miles up the MFWR valley and covers 4360 acres.
Data
Systematic Record
The systematic data included within this analysis is tabulated within the following table.
| Water Year | Flow (cfs) |
|---|---|
| 1912 | 34800 |
| 1924 | 11400 |
| 1925 | 27000 |
| 1926 | 19600 |
| 1927 | 55100 |
| 1928 | 29600 |
| 1929 | 21400 |
| 1930 | 26300 |
| 1931 | 28000 |
| 1932 | 41800 |
| 1933 | 20600 |
| 1934 | 18200 |
| 1935 | 27500 |
| 1936 | 19200 |
| 1937 | 29600 |
| 1938 | 23500 |
| 1939 | 10300 |
| 1940 | 9350 |
| 1941 | 7330 |
| 1942 | 33200 |
| 1943 | 53400 |
| 1944 | 17900 |
| 1945 | 21300 |
| 1946 | 81800 |
| 1947 | 34200 |
| 1948 | 43100 |
| 1949 | 38200 |
| 1950 | 17500 |
| 1951 | 62000 |
| 1952 | 25000 |
| 1953 | 62600 |
| 1954 | 60100 |
| 1955 | 12500 |
| 1956 | 72900 |
| 1957 | 59400 |
| 1958 | 35500 |
| 1959 | 17900 |
| 1960 | 14900 |
| 1961 | 35226 |
| 1962 | 29825 |
| 1963 | 24096 |
| 1964 | 21709 |
| 1965 | 112000 |
| 1966 | 36520 |
| 1967 | 26348 |
| 1968 | 27020 |
| 1969 | 22728 |
| 1970 | 32220 |
| 1971 | 67246 |
| 1972 | 48048 |
| 1973 | 13847 |
| 1974 | 37683 |
| 1975 | 15476 |
| 1976 | 41397 |
| 1977 | 4479 |
| 1978 | 39727 |
| 1979 | 25787 |
| 1980 | 46409 |
| 1981 | 24046 |
| 1982 | 59935 |
| 1983 | 27377 |
| 1984 | 40652 |
| 1986 | 46411 |
| 1987 | 19830 |
| 1988 | 25877 |
| 1989 | 27459 |
| 1990 | 25796 |
| 1991 | 16474 |
| 1992 | 21437 |
| 1993 | 25309 |
| 1994 | 7760 |
| 1995 | 27766 |
| 1996 | 37744 |
| 1997 | 59705 |
| 1998 | 22461 |
| 1999 | 36522 |
| 2000 | 19127 |
| 2001 | 7840 |
| 2002 | 18264 |
| 2003 | 17281 |
| 2004 | 27309 |
| 2005 | 25432 |
| 2006 | 41857 |
| 2007 | 27106 |
| 2008 | 12182 |
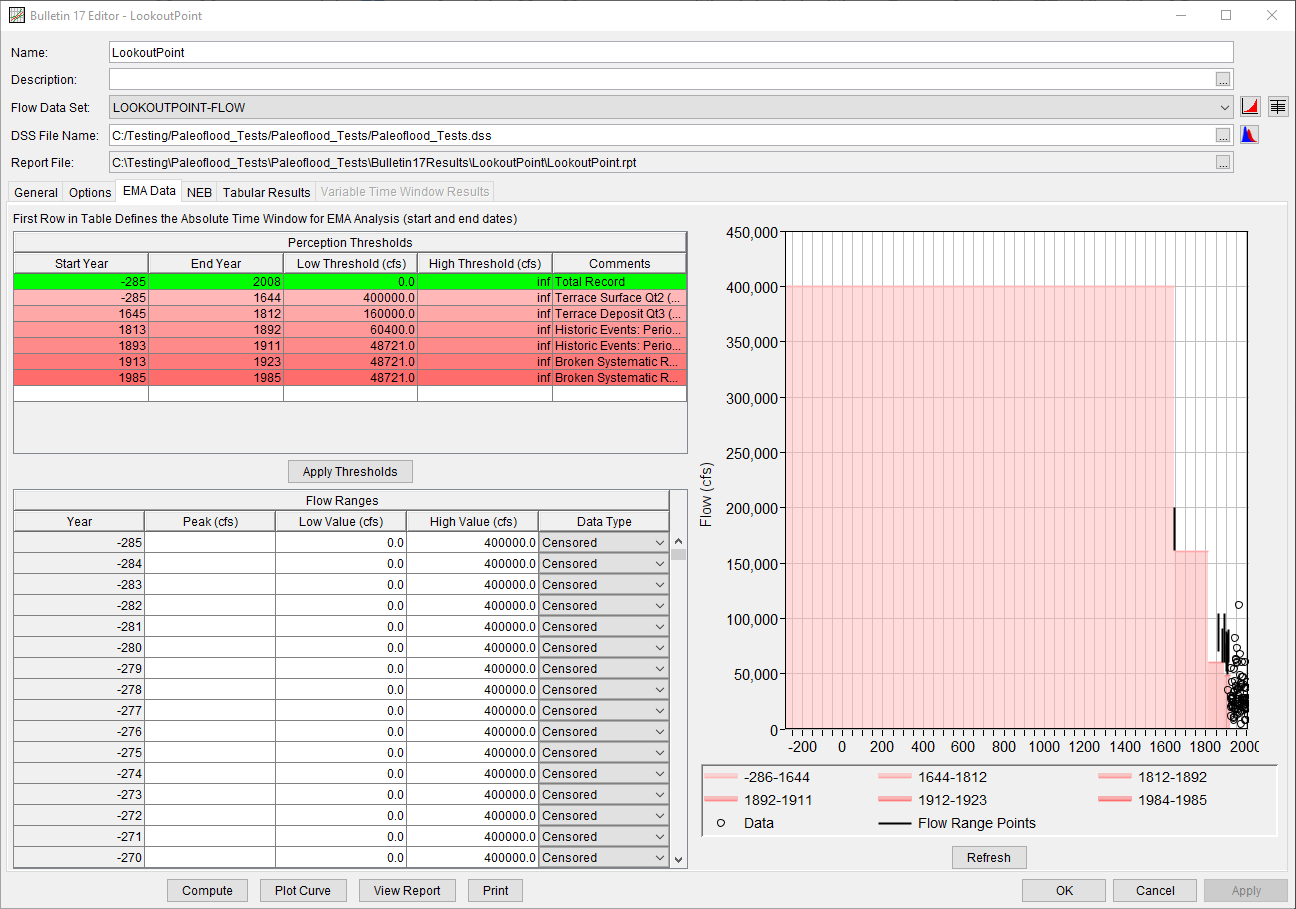
A perception threshold of 48721 cfs was inferred for the missing periods (WY1913 – WY1923, WY1985). This magnitude corresponds to the approximate magnitude of the Historic Events: Period B for WY1893 – WY1911. The perception thresholds used in combination with the systematic data are tabulated below.
| Start Year | End Year | Low Threshold (cfs) | High Threshold (cfs) | Comments |
|---|---|---|---|---|
| 1913 | 1923 | 48721 | inf | Broken Systematic Record |
| 1985 | 1985 | 48721 | inf | Broken Systematic Record |
Historical Record
Events prior to the systematic period of record (1912 and 1924-2008) from the above Systematic Record table were considered part of the historic record. The original studies associated with the development of each of the historical events are not referenced in the Lookout Point Dam Water Control Manual (USACE 2017), and could not be located for this study. However, the Lookout Point Water Control Manual does indicate that many of the historic peak magnitudes were the result of back calculations using downstream measurements at the time of the historical event. Recorded flows at Eugene and Jasper, Oregon were the two primary sources of downstream peak flow measurements.
| Start Year | End Year | Low Threshold (cfs) | High Threshold (cfs) | Comments |
|---|---|---|---|---|
| 1813 | 1892 | 60400 | inf | Historic Events: Period A |
| 1893 | 1911 | 48721 | inf | Historic Events: Period B |
Paleoflood
The field analysis yielded physical evidence of a high riverine terrace showing that during the past 2,200 to 2,400 years, there has not been a flood with a discharge of about 400,000 cfs (with a range of 280,000 to 500,000 cfs). A lower, inset terrace demonstrates the occurrence of a prehistoric flood about 370 years ago (with a range of 200 to 500 years), having a discharge of approximately 160,000 cfs (with a range of 120,000 to 200,000 cfs).
| Start Year | End Year | Low Threshold (cfs) | High Threshold (cfs) | Comments |
|---|---|---|---|---|
| -285 | 1644 | 400000 | inf | Terrace Surface Qt2 (NEB) |
| 1645 | 1812 | 160000 | inf | Terrace Deposit Qt3 (PSI) |
Bulletin 17 Analysis
A Bulletin 17 Analysis using Bulletin 17C procedures has been developed for this example. To open the analysis, either double-click on the analysis labeled "LookoutPoint" from the Study Explorer or from the Analysis menu select open, then select "LookoutPoint" from the list of available analyses. The previously-mentioned systematic, historical, and paleoflood data was entered within the EMA Data tab, as shown within the following figure.
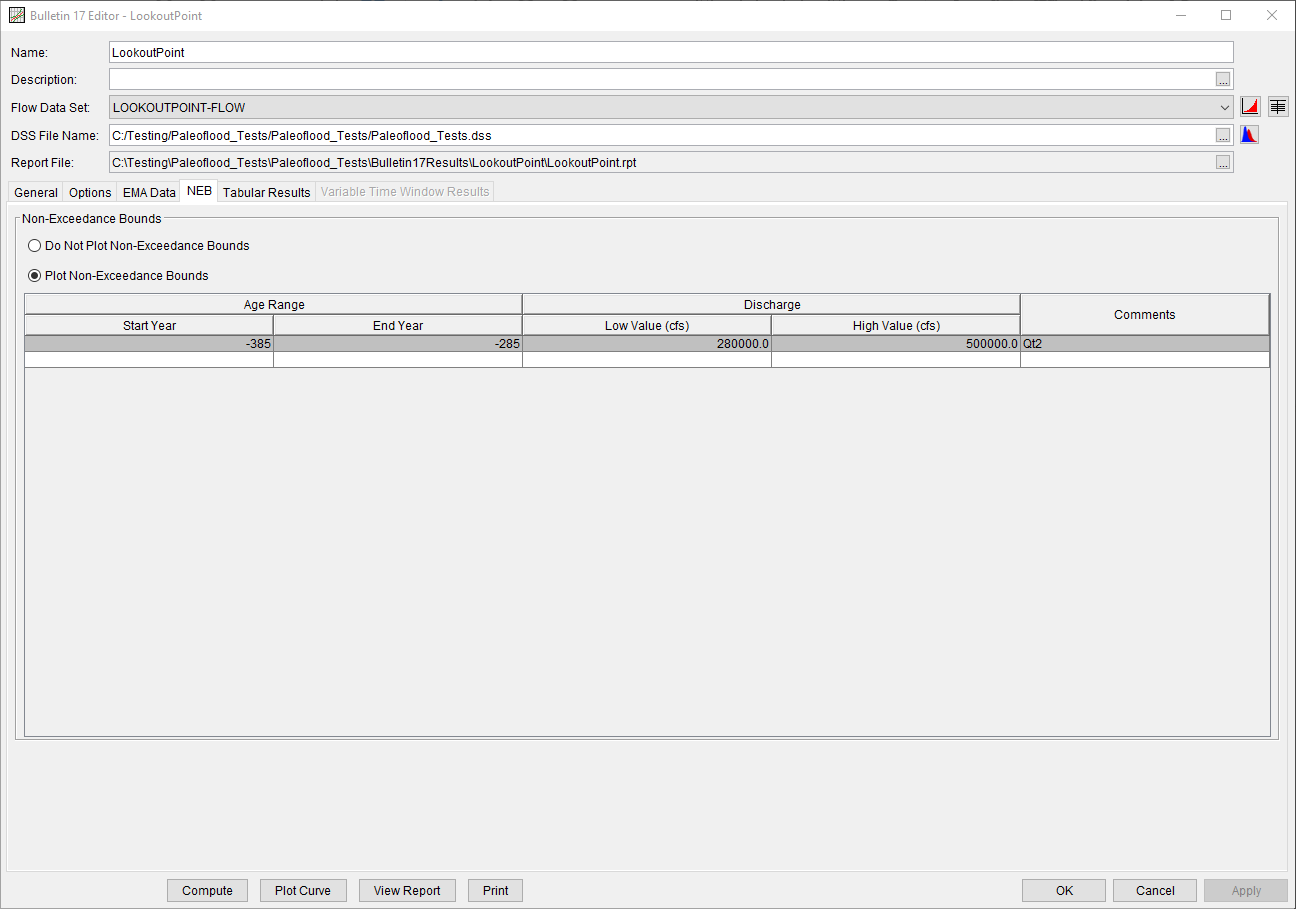
An NEB corresponding to the paleoflood data was entered on the NEB tab, as shown in the following figure. The Start and End Year correspond to an estimated age range of 2393 to 2293 years. The Low and High Value correspond to the estimated discharge ranges.
Results
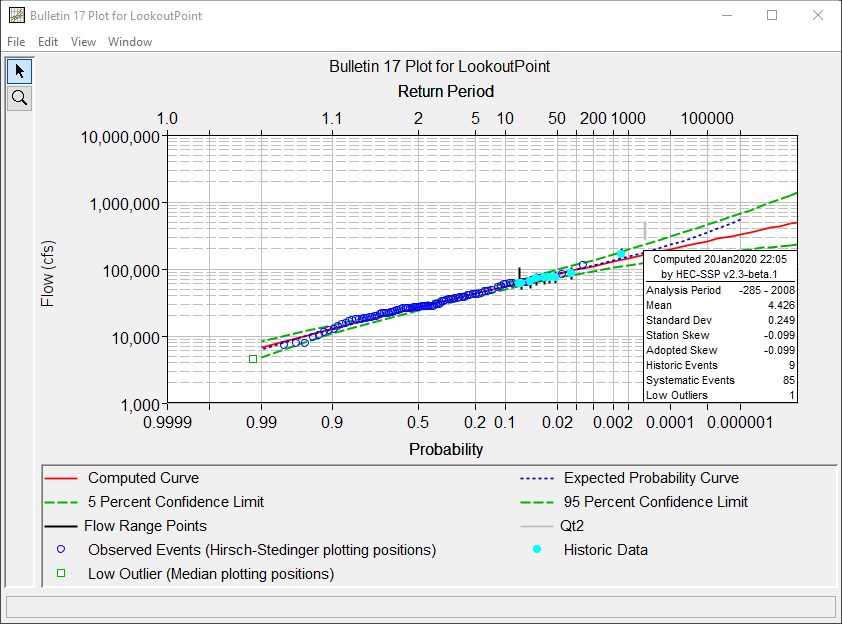
A plot summarizing the computed results is shown within the following figure.
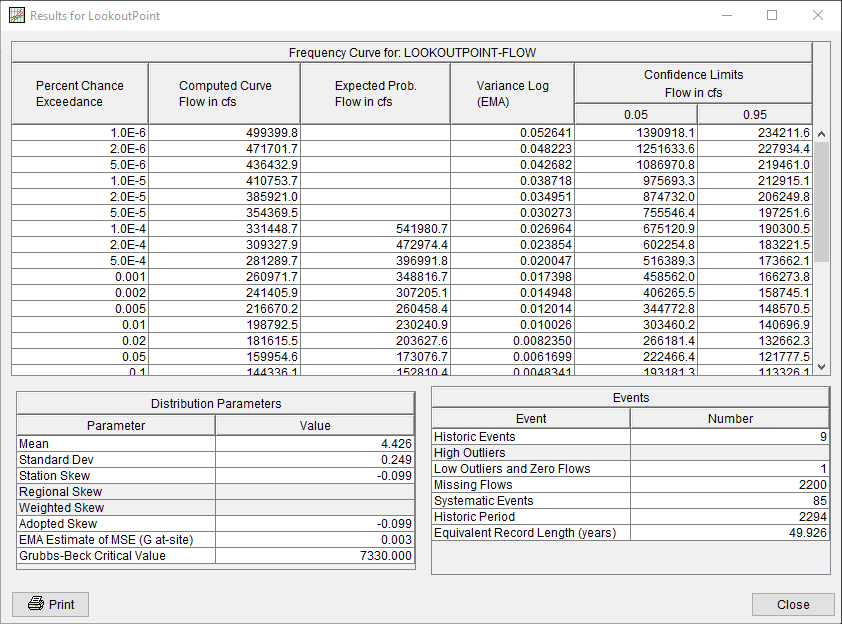
The Tabular Results tab is shown within the following figure.
