Download PDF
Download page Mojave River Dam.
Mojave River Dam
Background
Summary and Purpose
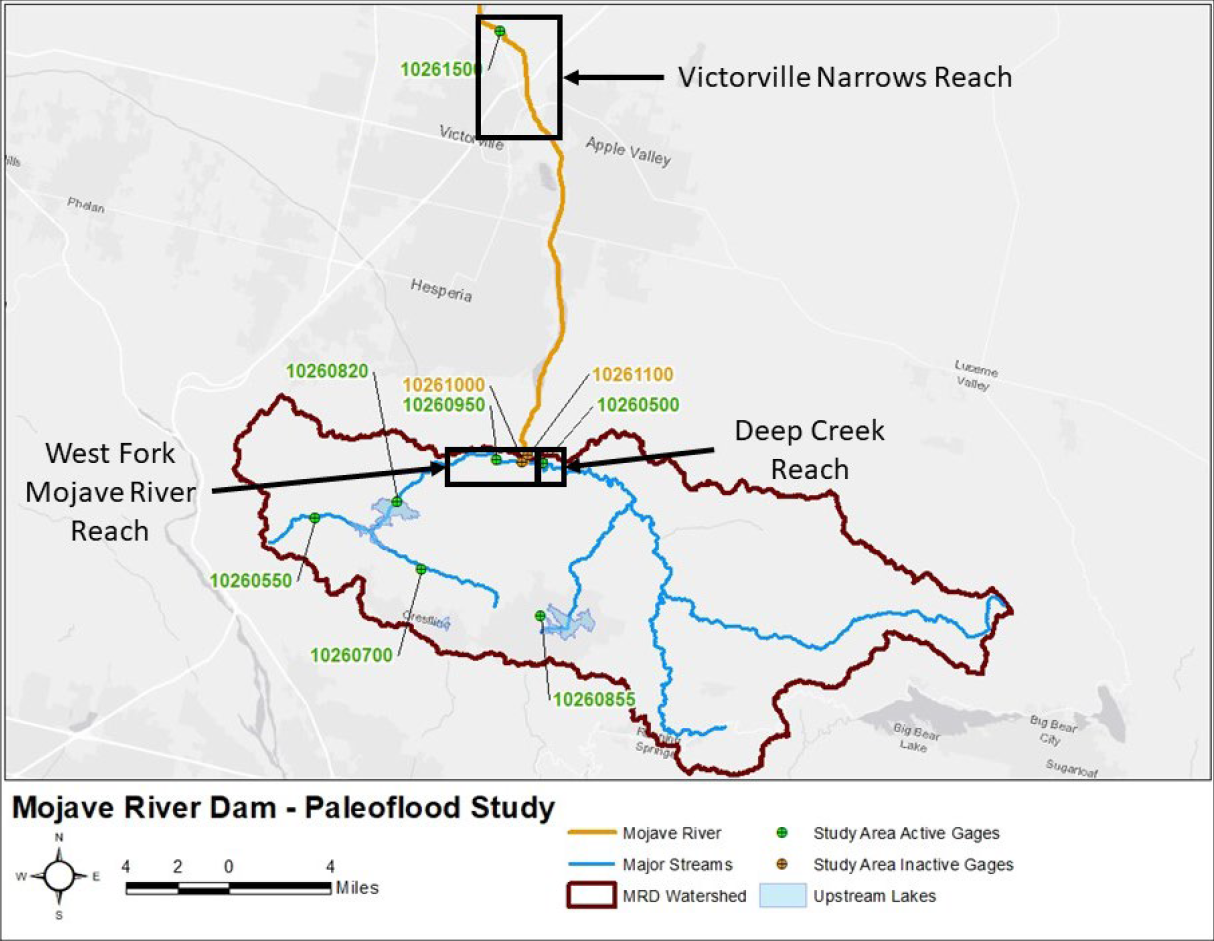
This paleoflood analysis represents an assessment of flood magnitude and chronology that builds upon an initial viability assessment (Kelson, Bartles, & Robinson, 2020). The viability analysis focused on reaches directly upstream of the dam along the West Fork Mojave River and Deep Creek, an alluvial reach in the cities of Hesperia and Apple Valley, and a bedrock gorge in the city of Victorville, as shown in the figure below. Initial field reconnaissance trips to assess viability occurred in late 2019 and early 2020, resulting in the conclusion that paleoflood information could be developed along the Mojave River watershed near the dam (Kelson, Bartles, & Robinson, 2020).
The effort describes herein represents a more detailed characterization of the paleoflood chronology along primary watersheds that inflow into Mojave River Dam, developed from very limited field data collection in July and September, 2020, additional archival research between July and December, 2020, and renewed hydraulic modeling in December 2020 and January 2021. An improved characterization of the paleoflood chronology of the Mojave River watershed upstream of Mojave River Dam is described below.
Project Description
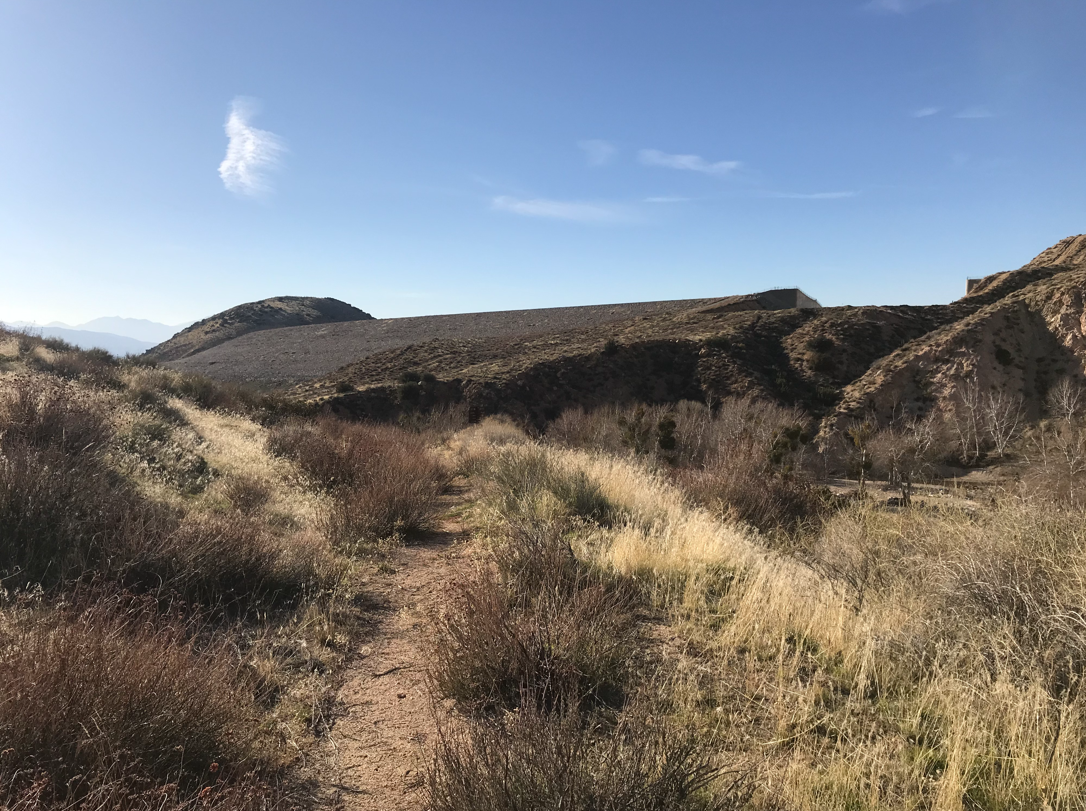
The Mojave River Dam project includes an earth-fill main embankment, an earth-fill saddle dike located in a shallow saddle approximately 1,300 feet west of the left abutment of the main dam, an ungated outlet works, and a detached, concrete lined, broad crested weir-type spillway located in the right abutment of the dam, as shown in the figure below. Dam construction began in June 1967 and was completed in May 1971. The main and saddle dams are upstream of the towns of Hesperia, Apple Valley, and Victorville, in western San Bernardino County.
Download a copy of the project report here: PF_MOJ_AppD_Frequency_20210806.pdf
Data
Systematic Description
The total combined systematic record length includes 108 discrete events spanning 114 years (WY1905 – WY2019). A missing period was found to span WY1923 – WY1929. The systematic data that was created as part of this analysis is tabulated below. Unless noted, all other years were assumed to not have any uncertainty in the reported flow magnitude.
| Date | Water Year | Mid (cfs) | Low (cfs) | High (cfs) | Source |
|---|---|---|---|---|---|
3/14/1905 | 1905 | 26000 | 1 | ||
3/13/1906 | 1906 | 14000 | 1 | ||
3/5/1907 | 1907 | 19000 | 1 | ||
1/25/1908 | 1908 | 3800 | 1 | ||
1/22/1909 | 1909 | 8800 | 1 | ||
1/1/1910 | 1910 | 62000 | 1 | ||
3/9/1911 | 1911 | 11000 | 1 | ||
3/11/1912 | 1912 | 750 | 7 | ||
4/3/1913 | 1913 | 250 | 7 | ||
2/19/1914 | 1914 | 26000 | 1 | ||
2/10/1915 | 1915 | 12000 | 1 | ||
1/18/1916 | 1916 | 36000 | 1 | ||
3/30/1917 | 1917 | 325 | 7 | ||
3/7/1918 | 1918 | 14000 | 1 | ||
4/3/1919 | 1919 | 200 | 7 | ||
2/21/1920 | 1920 | 6700 | 1 | ||
3/14/1921 | 1921 | 5900 | 1 | ||
12/21/1921 | 1922 | 36000 | 1 | ||
3/5/1930 | 1930 | 1100 | 1 | ||
4/26/1931 | 1931 | 2310 | 1 | ||
2/9/1932 | 1932 | 15610 | 1 | ||
4/4/1933 | 1933 | 560 | 1 | ||
12/31/1933 | 1934 | 3720 | 1 | ||
4/8/1935 | 1935 | 4040 | 1 | ||
2/12/1936 | 1936 | 2590 | 1 | ||
2/14/1937 | 1937 | 8760 | 1 | ||
3/2/1938 | 1938 | 72700 | 1 | ||
9/25/1939 | 1939 | 2350 | 2 | ||
1/8/1940 | 1940 | 4000 | 1 | ||
2/20/1941 | 1941 | 6460 | 1 | ||
4/4/1942 | 1942 | 800 | 1 | ||
1/23/1943 | 1943 | 42000 | 1 | ||
2/22/1944 | 1944 | 6750 | 1 | ||
2/2/1945 | 1945 | 8700 | 1 | ||
3/30/1946 | 1946 | 11900 | 1 | ||
11/13/1946 | 1947 | 3920 | 1 | ||
4/4/1948 | 1948 | 1340 | 1 | ||
4/14/1949 | 1949 | 550 | 1 | ||
2/7/1950 | 1950 | 1200 | 1 | ||
5/3/1951 | 1951 | 40 | 1 | ||
3/15/1952 | 1952 | 9400 | 1 | ||
1/7/1953 | 1953 | 240 | 1 | ||
1/25/1954 | 1954 | 9780 | 1 | ||
2/17/1955 | 1955 | 510 | 2 | ||
1/27/1956 | 1956 | 7620 | 2 | ||
1/13/1957 | 1957 | 12060 | 2 | ||
4/3/1958 | 1958 | 22600 | 2 | ||
2/16/1959 | 1959 | 9720 | 2 | ||
4/28/1960 | 1960 | 960 | 2 | ||
4/4/1961 | 1961 | 1780 | 2 | ||
2/11/1962 | 1962 | 10790 | 2 | ||
2/10/1963 | 1963 | 830 | 2 | ||
4/1/1964 | 1964 | 610 | 2 | ||
4/23/1965 | 1965 | 1860 | 2 | ||
12/29/1965 | 1966 | 39920 | 2 | ||
12/6/1966 | 1967 | 21720 | 2 | ||
11/20/1967 | 1968 | 1340 | 2 | ||
1/25/1969 | 1969 | 36200 | 2 | ||
2/28/1970 | 1970 | 960 | 2 | ||
11/29/1970 | 1971 | 5520 | 2 | ||
12/25/1971 | 1972 | 10000 | 7 | ||
2/12/1973 | 1973 | 7500 | 7 | ||
3/3/1974 | 1974 | 1100 | 7 | ||
3/9/1975 | 1975 | 825 | 4 | ||
9/12/1976 | 1976 | 5150 | 5 | ||
5/9/1977 | 1977 | 1000 | 4 | ||
3/5/1978 | 1978 | 22800 | 18300 | 28300 | 5 |
3/28/1979 | 1979 | 6870 | 4 | ||
2/18/1980 | 1980 | 21200 | 18200 | 24800 | 5 |
1/30/1981 | 1981 | 300 | 6 | ||
3/18/1982 | 1982 | 3850 | 6 | ||
3/2/1983 | 1983 | 18500 | 15500 | 22100 | 4 |
12/26/1983 | 1984 | 5870 | 4 | ||
12/20/1984 | 1985 | 1775 | 4 | ||
2/16/1986 | 1986 | 5500 | 4 | ||
3/7/1987 | 1987 | 1725 | 4 | ||
4/21/1988 | 1988 | 775 | 5 | ||
2/11/1989 | 1989 | 605 | 5 | ||
2/22/1990 | 1990 | 90 | 6 | ||
3/2/1991 | 1991 | 9000 | 4 | ||
2/13/1992 | 1992 | 12500 | 10900 | 14400 | 4 |
1/8/1993 | 1993 | 14400 | 11200 | 18400 | 5 |
2/8/1994 | 1994 | 4325 | 5 | ||
1/11/1995 | 1995 | 12300 | 10200 | 14700 | 4 |
2/22/1996 | 1996 | 7940 | 4 | ||
1/27/1997 | 1997 | 6740 | 4 | ||
2/24/1998 | 1998 | 19400 | 15600 | 24000 | 4 |
4/16/1999 | 1999 | 110 | 3 | ||
2/22/2000 | 2000 | 2560 | 4 | ||
2/14/2001 | 2001 | 410 | 3 | ||
11/26/2001 | 2002 | 15 | 3 | ||
3/17/2003 | 2003 | 6300 | 4 | ||
12/26/2003 | 2004 | 9000 | 4 | ||
1/12/2005 | 2005 | 29700 | 3 | ||
4/6/2006 | 2006 | 12300 | 9700 | 15700 | 5 |
9/1/2007 | 2007 | 91 | 5 | ||
1/28/2008 | 2008 | 8140 | 4 | ||
2/17/2009 | 2009 | 1610 | 4 | ||
2/7/2010 | 2010 | 9000 | 8 | ||
12/23/2010 | 2011 | 24000 | 3 | ||
3/27/2012 | 2012 | 360 | 3 | ||
1/26/2013 | 2013 | 110 | 5 | ||
3/1/2014 | 2014 | 5860 | 4 | ||
12/5/2014 | 2015 | 880 | 3 | ||
2/1/2016 | 2016 | 2200 | 4 | ||
1/24/2017 | 2017 | 5250 | 4 | ||
3/23/2018 | 2018 | 1010 | 5 | ||
2/14/2019 | 2019 | 11700 | 3 |
1 - Report on Survey for Flood Control (1956)
2 - Evaluation of Proposed Modifications (1985)
3 - SPL-Reservoir Regulation Section
4 - Deep Creek peak + WF Mojave River peak
5 - Deep Creek peak w/ daily average WF Mojave River
6 - Deep Creek daily average w/ WF Mojave River peak
7 - Deep Creek peak w/ missing WF Mojave River peak
8 - Deep Creek peak w/ 15-min peak WF Mojave River
A perception threshold of 23500 cfs was inferred for the missing period (WY1923 – WY1929). This magnitude corresponds to the approximate channel capacity of the Mojave River downstream of the dam site (U.S. Army Corps of Engineers, 1956). Local interests historically maintained this approximate channel capacity while, in more recent times, the San Bernardino County Flood Control District has taken over maintenance and regulation of the Mojave River downstream of the dam site. The perception thresholds used in combination with the systematic data are tabulated below.
Start Year | End Year | Low Threshold (cfs) | High Threshold (cfs) | Comments |
|---|---|---|---|---|
1905 | 2019 | 0 | inf | Total Record |
1923 | 1929 | 23500 | inf | Approx. Channel Capacity |
Historical Record
A total of six historical flood events were identified for inclusion, as shown below. Except for WY1862, all years were assumed to have no uncertainty in the peak flow magnitude.
Date | WY | Mid (cfs) | Low (cfs) | High (cfs) | Source |
|---|---|---|---|---|---|
12/1859 | 1860 | 30000 | 1 | ||
1/22/1862 | 1862 | 106500 | 75000 | 150000 | 1, 2 |
12/1867 | 1868 | 78000 | 1 | ||
3/7/1884 | 1884 | 40000 | 1 | ||
2/17/1886 | 1886 | 30000 | 1 | ||
2/23/1891 | 1891 | 75000 | 1 |
1 - Report on Survey for Flood Control (USACE, 1956)
2 - The California Storm of January 1862 (Engstrom, 1996)
A single perception threshold of 23500 cfs was inferred for the missing period between 1860 and the start of the systematic record in WY1905. This magnitude corresponds to the approximate channel capacity of the Mojave River downstream of the dam site (U.S. Army Corps of Engineers, 1956). Local interests historically maintained this approximate channel capacity while, in more recent times, the San Bernardino County Flood Control District has taken over maintenance and regulation of the Mojave River downstream of the dam site. The perception thresholds used in combination with the historical and systematic data are tabulated below.
| Start Year | End Year | Low Threshold (cfs) | High Threshold (cfs) | Comments |
|---|---|---|---|---|
1860 | 2019 | 0 | inf | Total Record |
1860 | 1904 | 23500 | inf | Approx. Channel Capacity |
1923 | 1929 | 23500 | inf | Approx. Channel Capacity |
Paleoflood
In this analysis, a paleoflood PSI was identified for the period prior to the start of historical data in WY1860. The magnitude of the paleoflood PSI ranged from 275000 cfs to 425000 cfs with a best estimate of 375000 cfs. The age of the paleoflood PSI spanned from 1100 years old to 1800 years old with a best estimate age of 1500 years old. All ages are referenced to the date in which the samples were collected (2020). The paleoflood PSI data is summarized within the following table.
Geomorphic Datum | Estimated Age (years before 2020) | Estimated Total Inflow Paleodischarge (cfs) | ||
|---|---|---|---|---|
West Fork Terrace (PSI) | Young Best Old | 1,100 years 1,500 years 1,800 years | Low Best High | 275,000 375,000 425,000 |
The perception thresholds used in combination with the best estimate paleoflood, historical, and systematic data are tabulated within the following table.
Start Year | End Year | Low Threshold (cfs) | High Threshold (cfs) | Comments |
|---|---|---|---|---|
520 | 2019 | 0 | inf | Total Record |
520 | 1859 | 375,000 | Inf | Eolian deposit at WF-6, WF-5, WF-3, and WF-2 (PSI) |
1860 | 1904 | 23,500 | inf | Approx. Channel Capacity |
1923 | 1929 | 23,500 | inf | Approx. Channel Capacity |
Bulletin 17 Analysis
A Bulletin 17 Analysis using Bulletin 17C procedures has been developed for this example. To open the analysis, either double-click on the analysis labeled "MojaveRiver" from the Study Explorer or from the Analysis menu select open, then select "MojaveRiver" from the list of available analyses. The previously-mentioned systematic, historical, and paleoflood data was entered within the EMA Data tab, as shown within the following figure.
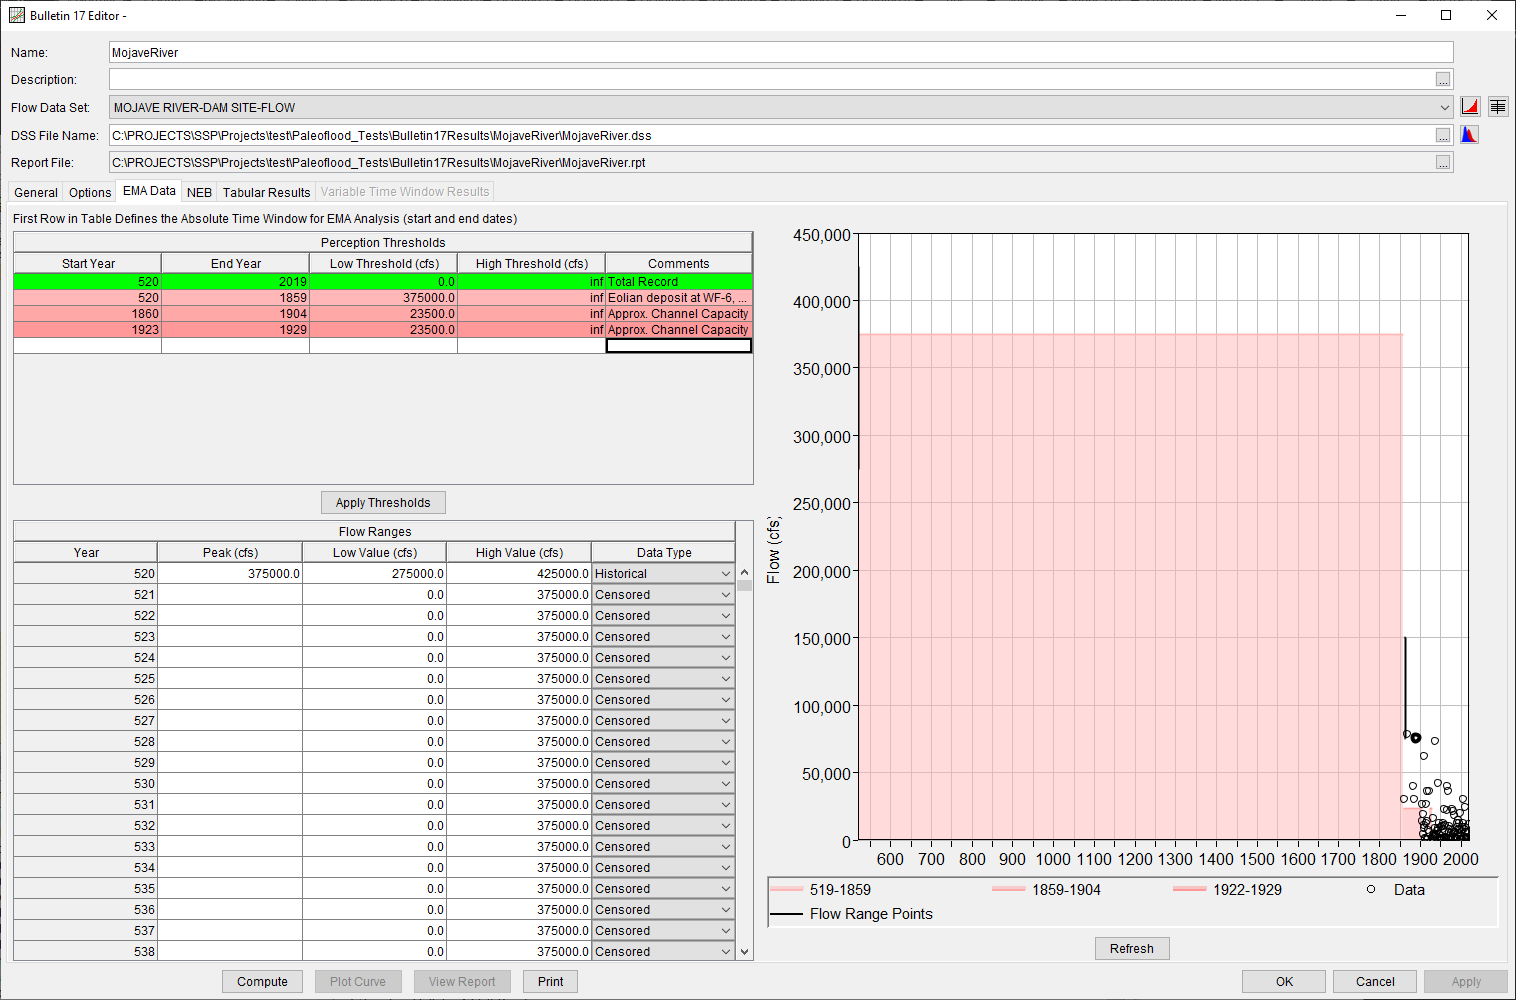
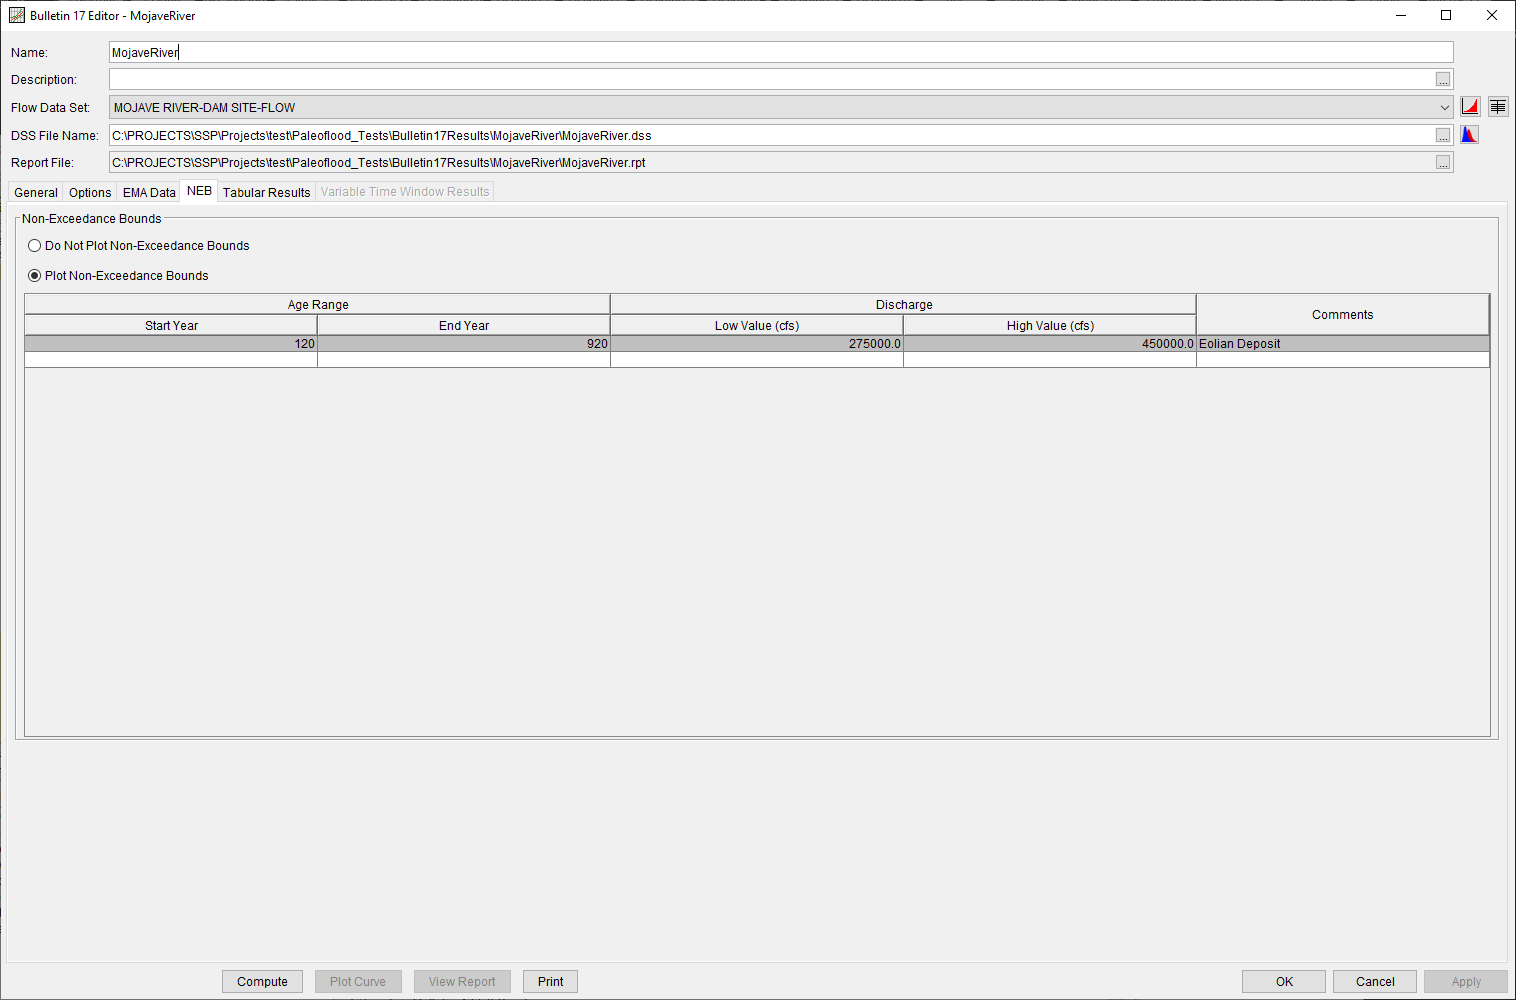
An NEB corresponding to the paleoflood data was entered on the NEB tab, as shown in the following figure. The Start and End Year correspond to an estimated age range of xxx to xxx years. The Low and High Value correspond to the estimated discharge ranges.
Results
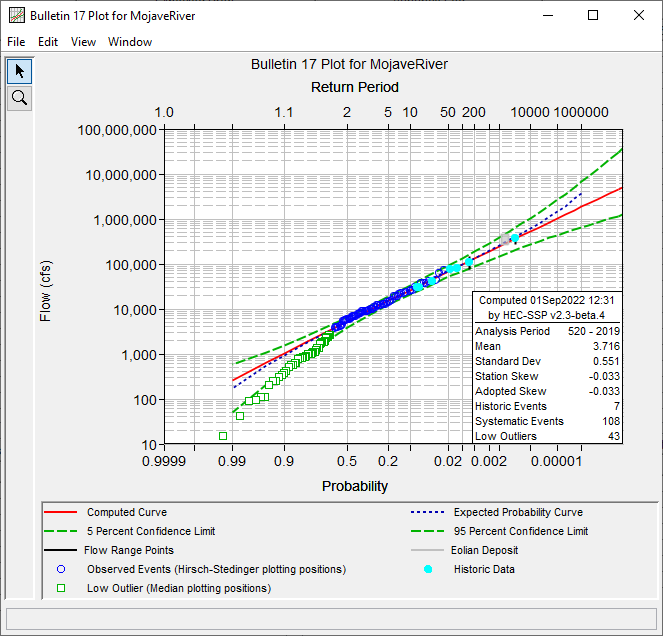
A plot summarizing the computed results is shown within the following figure.
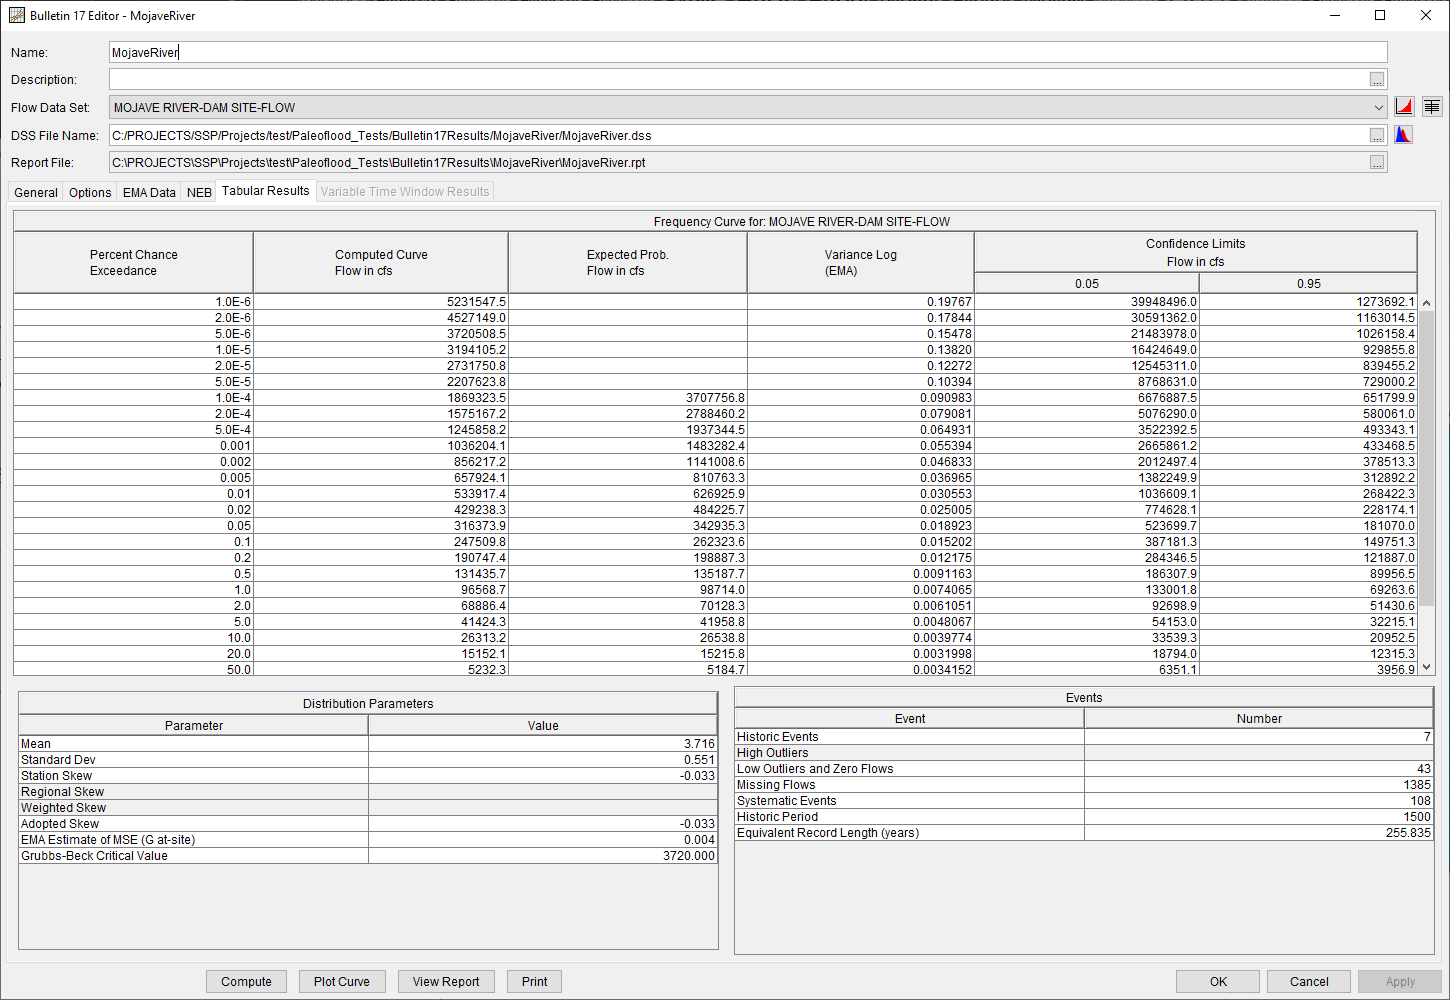
The Tabular Results tab is shown within the following figure.
