Download PDF
Download page Proctor Dam.
Proctor Dam
Background
Summary and Purpose
This paleoflood analysis addresses the long-term flood history for Proctor Dam, located along the Leon River upstream of Comanche, Texas. The field reconnaissance effort provides information on historic and pre-historic large discharges along the Leon River, including geomorphic evidence of surface stability and a lack of inundation over the past few millennia. Geomorphic and stratigraphic evidence show that a sandy deposit located about 25 feet above the Leon River has not been eroded since its formation approximately 2,000 to 5,000 years ago. Based on initial hydraulic calculations at a location downstream of the dam, the paleodischarge that would have inundated and eroded this deposit is approximately 105,000 cfs, within a range of 90,000 to 160,000 cfs.
The results of this reconnaissance can be used for improving estimates of the frequency of large inflow volumes into Proctor Lake. Combining updated hydrologic and paleoflood analyses can help estimate effects of large inflow volumes to the reservoir pool-stage frequency curves and constrain unregulated instantaneous peak inflow-frequency curves.
This analysis was completed through limited field reconnaissance and post-field hydraulic analyses, and is associated with relatively large, but reasonable, degrees of uncertainty. This analysis provides reasonable paleoflood data to help constrain inflow frequencies at rare annual exceedance probabilities. Recommendations are provided for additional efforts that could yield reductions in the degree of uncertainty at rare annual exceedance probabilities.
Download a copy of the project report here: Project Report
Project Description
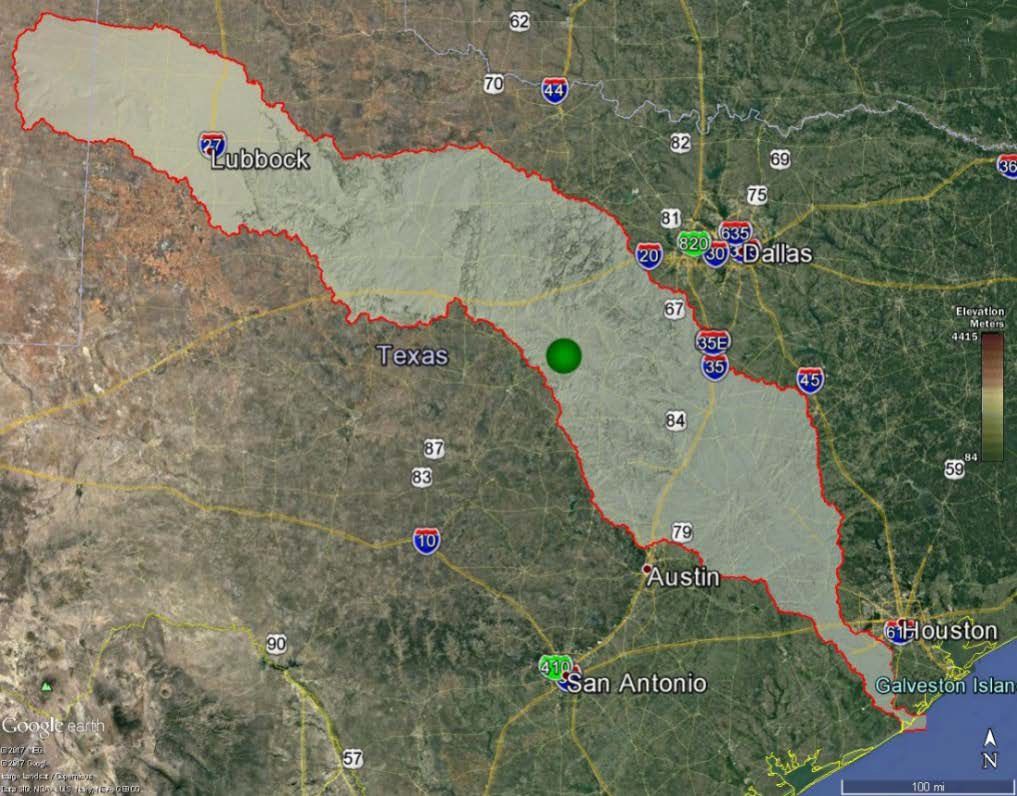
Proctor Dam is located near Proctor, Texas at river mile 238.9 on the Leon River, Brazos River Basin, in Comanche County, about 8 miles northeast of Comanche, TX as shown in the figure below. The Leon River watershed is in the central portion of the state and the 1,259 mi2 drainage area contributing to Proctor Dam is equivalent to approximately 34 percent of the Leon River watershed. Inflow into Proctor Dam is partially regulated by Lake Leon (259 mi2), located about 48 miles upstream and operated by Eastland County Water Supply District. The Leon River flows southeast from Proctor Dam approximately 192 river miles into Belton Lake. Water is released through Belton Dam back into the Leon River where it travels another 17 river miles until reaching the confluence with the Lampasas River near Belton, TX which forms the Little River. The Little River flows 214 miles to join the Brazos River near Hearne, TX and eventually discharges to the Gulf of Mexico at Freeport, TX.
Construction of the earthen embankment began in January 1961 with deliberate impoundment of the dam and concrete spillway starting in September 1963. The embankment consists of a rolled earth fill dam with rock slope protection, is approximately 13,020 feet (2.5 miles) long, and has a structural height of 86 feet.
Data
Systematic Description
| Water Year | Flow (cfs) |
|---|---|
| 1939 | 11400 |
| 1940 | 3090 |
| 1941 | 13100 |
| 1942 | 11600 |
| 1943 | 14000 |
| 1944 | 7280 |
| 1945 | 8740 |
| 1946 | 1420 |
| 1947 | 2900 |
| 1948 | 820 |
| 1949 | 10900 |
| 1950 | 1890 |
| 1951 | 1380 |
| 1952 | 19700 |
| 1953 | 1290 |
| 1954 | 3760 |
| 1955 | 6670 |
| 1956 | 20100 |
| 1957 | 14100 |
| 1958 | 3600 |
| 1959 | 1620 |
| 1960 | 23100 |
| 1961 | 3070 |
| 1962 | 20100 |
| 1963 | 7157 |
| 1964 | 14966 |
| 1965 | 10670 |
| 1966 | 8824 |
| 1967 | 5056 |
| 1968 | 18230 |
| 1969 | 6540 |
| 1970 | 3293 |
| 1971 | 2879 |
| 1972 | 1993 |
| 1973 | 8514 |
| 1974 | 3730 |
| 1975 | 3019 |
| 1976 | 1965 |
| 1977 | 12341 |
| 1978 | 796 |
| 1979 | 3129 |
| 1980 | 2495 |
| 1981 | 1266 |
| 1982 | 5485 |
| 1983 | 449 |
| 1984 | 1675 |
| 1985 | 8307 |
| 1986 | 17527 |
| 1987 | 9345 |
| 1988 | 17096 |
| 1989 | 14901 |
| 1990 | 100817 |
| 1991 | 5337 |
| 1992 | 26678 |
| 1993 | 1708 |
| 1994 | 13370 |
| 1995 | 12813 |
| 1996 | 3107 |
| 1997 | 16756 |
| 1998 | 10403 |
| 1999 | 2575 |
| 2000 | 274 |
| 2001 | 2408 |
| 2002 | 4294 |
| 2003 | 2213 |
| 2004 | 4563 |
| 2005 | 3000 |
| 2006 | 2255 |
| 2007 | 26755 |
| 2008 | 3264 |
| 2009 | 1305 |
| 2010 | 1404 |
| 2011 | 1118 |
| 2012 | 6767 |
| 2013 | 1920 |
| 2014 | 787 |
| 2015 | 13442 |
| 2016 | 27866 |
| 2017 | 3875 |
| 2018 | 672 |
| 2019 | 16297 |
Paleoflood
The discharge estimation analysis utilized Hydrologic Engineering Center River Analysis System (HEC-RAS) modeling created for the Corps Water Management System (CWMS) effort in 2016.
The Manning’s n values used in the model geometry are 0.04 in the channel and 0.07 in the overbank areas. Routing steady flows through this model calculated water surface elevations below the USGS rating curve for most flows. The Manning’s n values were iteratively increased to values of 0.06 for the channel and 0.10 for overbank areas to produce water surface elevations that matched closely to the USGS rating curve of approximately elevation 1,130 feet for a flow of 15,000 cfs, which is the approximate peak release from Proctor Dam in early June 2016. The Manning’s n values are at the high end of the reasonable range upon review of published values in the HEC-RAS Technical Reference Manual. Increasing Manning’s n values is reasonable considering vegetation conditions thousands of years ago that probably were rougher than current conditions. It should be noted that upstream bridges were included in model geometry for calibration efforts, but were removed for paleoflood routings.
Using this model calibration, larger flows were routed in an attempt to achieve a water surface elevation corresponding to the top of the in situ eolian deposits present in the Leon Quarry exposure of 1,144 ft (i.e., top of soil A-horizon). The flow rate calculated to attain this elevation was 105,000 cfs. This value of 105,000 cfs is the preferred paleodischarge estimate based on the model calibration.
| Start Year | End Year | Low Threshold (cfs) | High Threshold (cfs) | Comments |
|---|---|---|---|---|
| -1483 | 1938 | 100000 | inf | Leon Quarry NEB |
Bulletin 17 Analysis
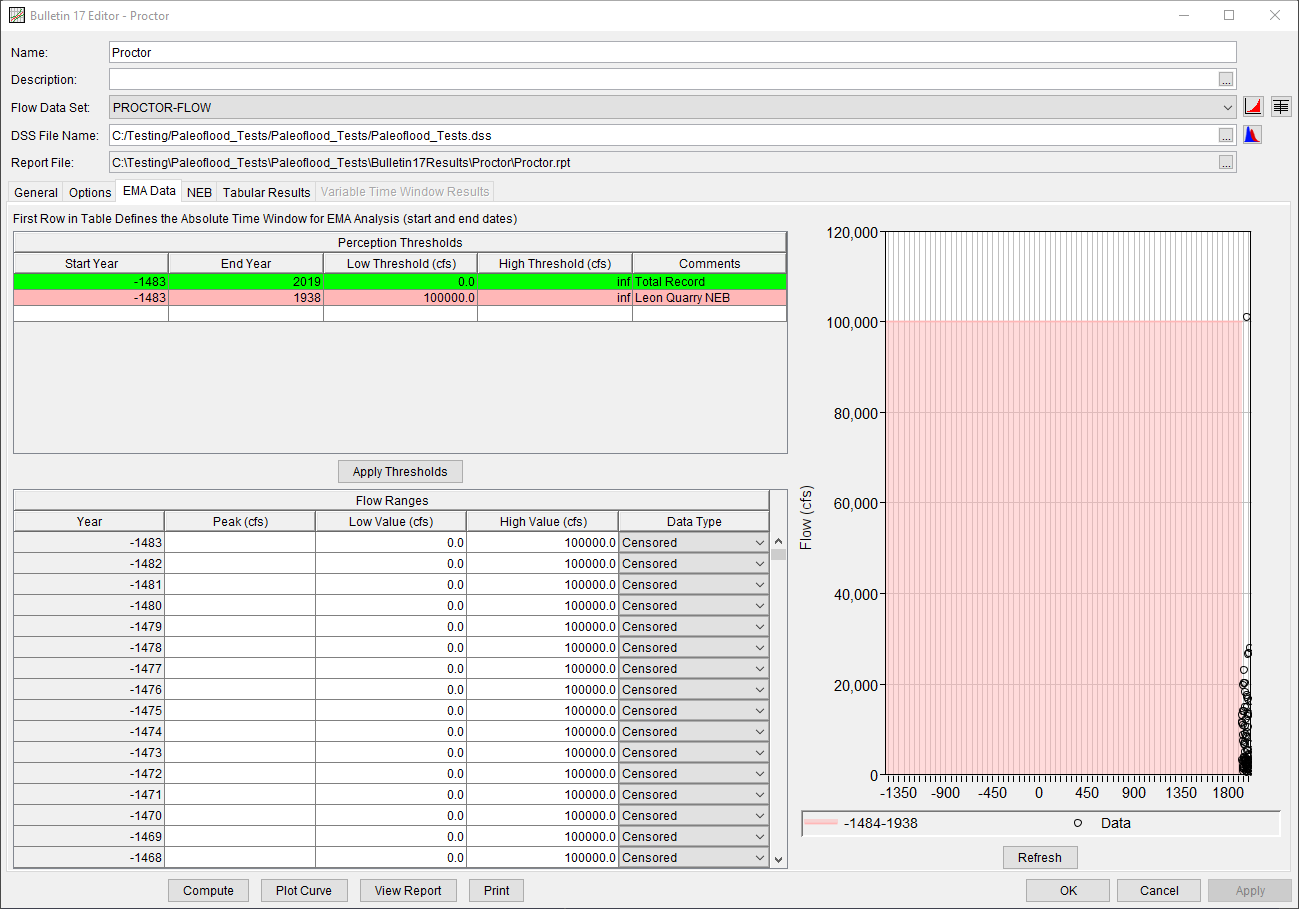
A Bulletin 17 Analysis using Bulletin 17C procedures has been developed for this example. To open the analysis, either double-click on the analysis labeled "Proctor" from the Study Explorer or from the Analysis menu select open, then select "Proctor" from the list of available analyses. The previously-mentioned systematic and paleoflood data was entered within the EMA Data tab, as shown within the following figure.
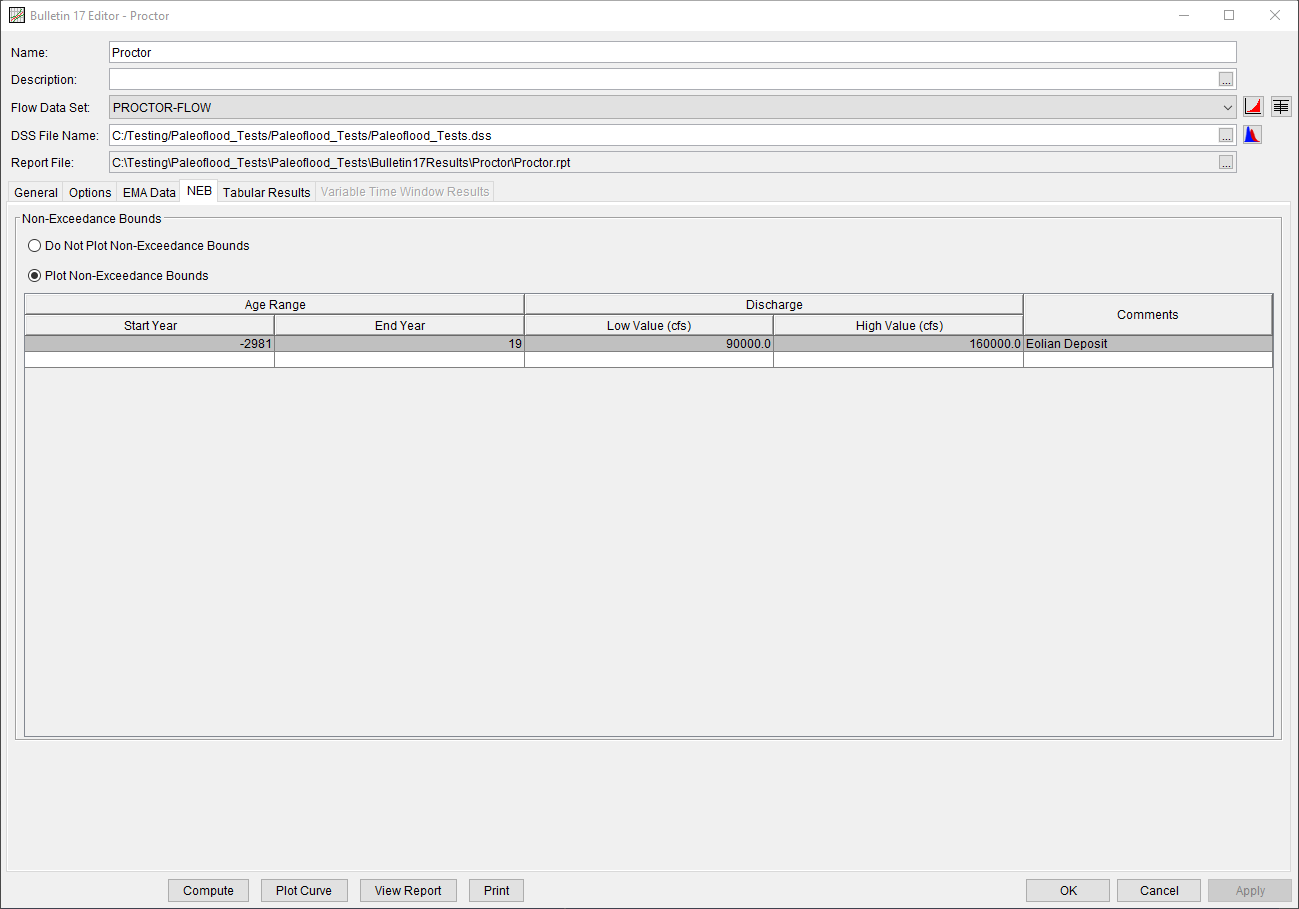
An NEB corresponding to the paleoflood data was entered on the NEB tab, as shown in the following figure. The Start and End Year correspond to an estimated age range of 5000 to 2000 years. The Low and High Value correspond to the estimated discharge ranges.
Results
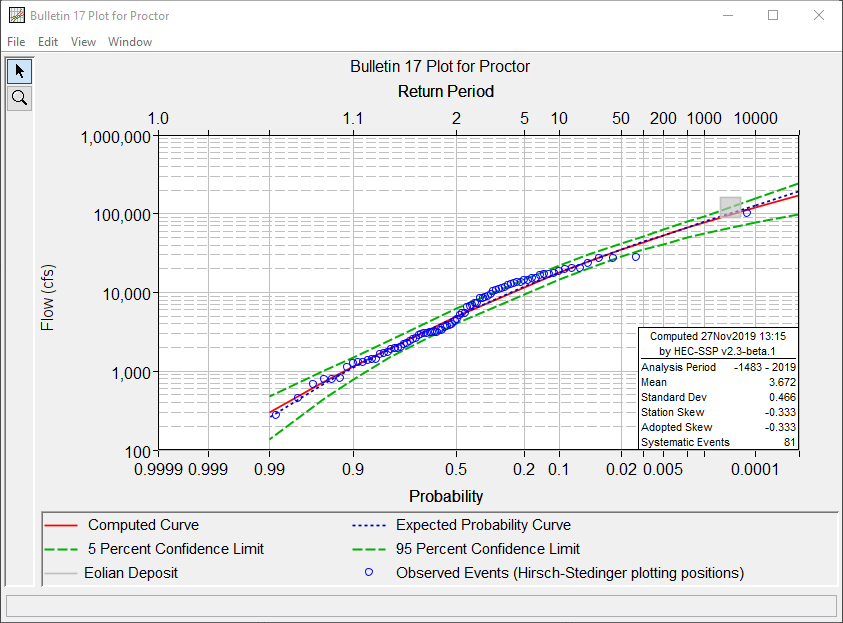
A plot summarizing the computed results is shown within the following figure.
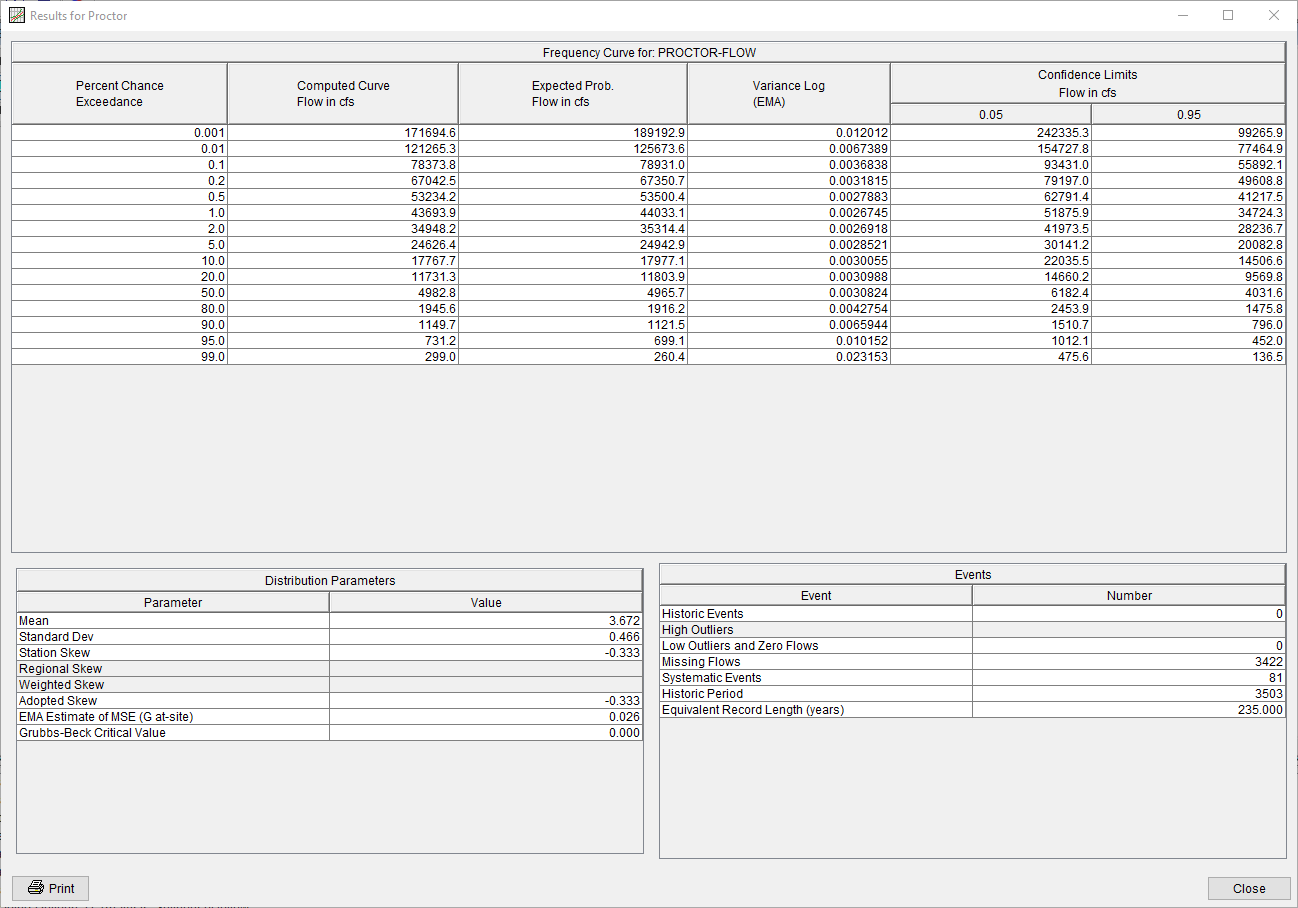
The Tabular Results tab is shown within the following figure.
