Download PDF
Download page Introduction to RStudio.
Introduction to RStudio
R is usually run in an integrated development environment (IDE) such as RStudio. The use of RStudio for this workshop does not constitute an endorsement of RStudio by the United States Army Corps of Engineers.
IDEs simplify many processes for developing code. RStudio in particular for R gives you tools for managing packages, viewing plots, seeing data and variables that have been defined, executing code, and so on.
This guide is meant to familiarize you with some of the features of RStudio so that you can get started on some analyses.
The RStudio Interface
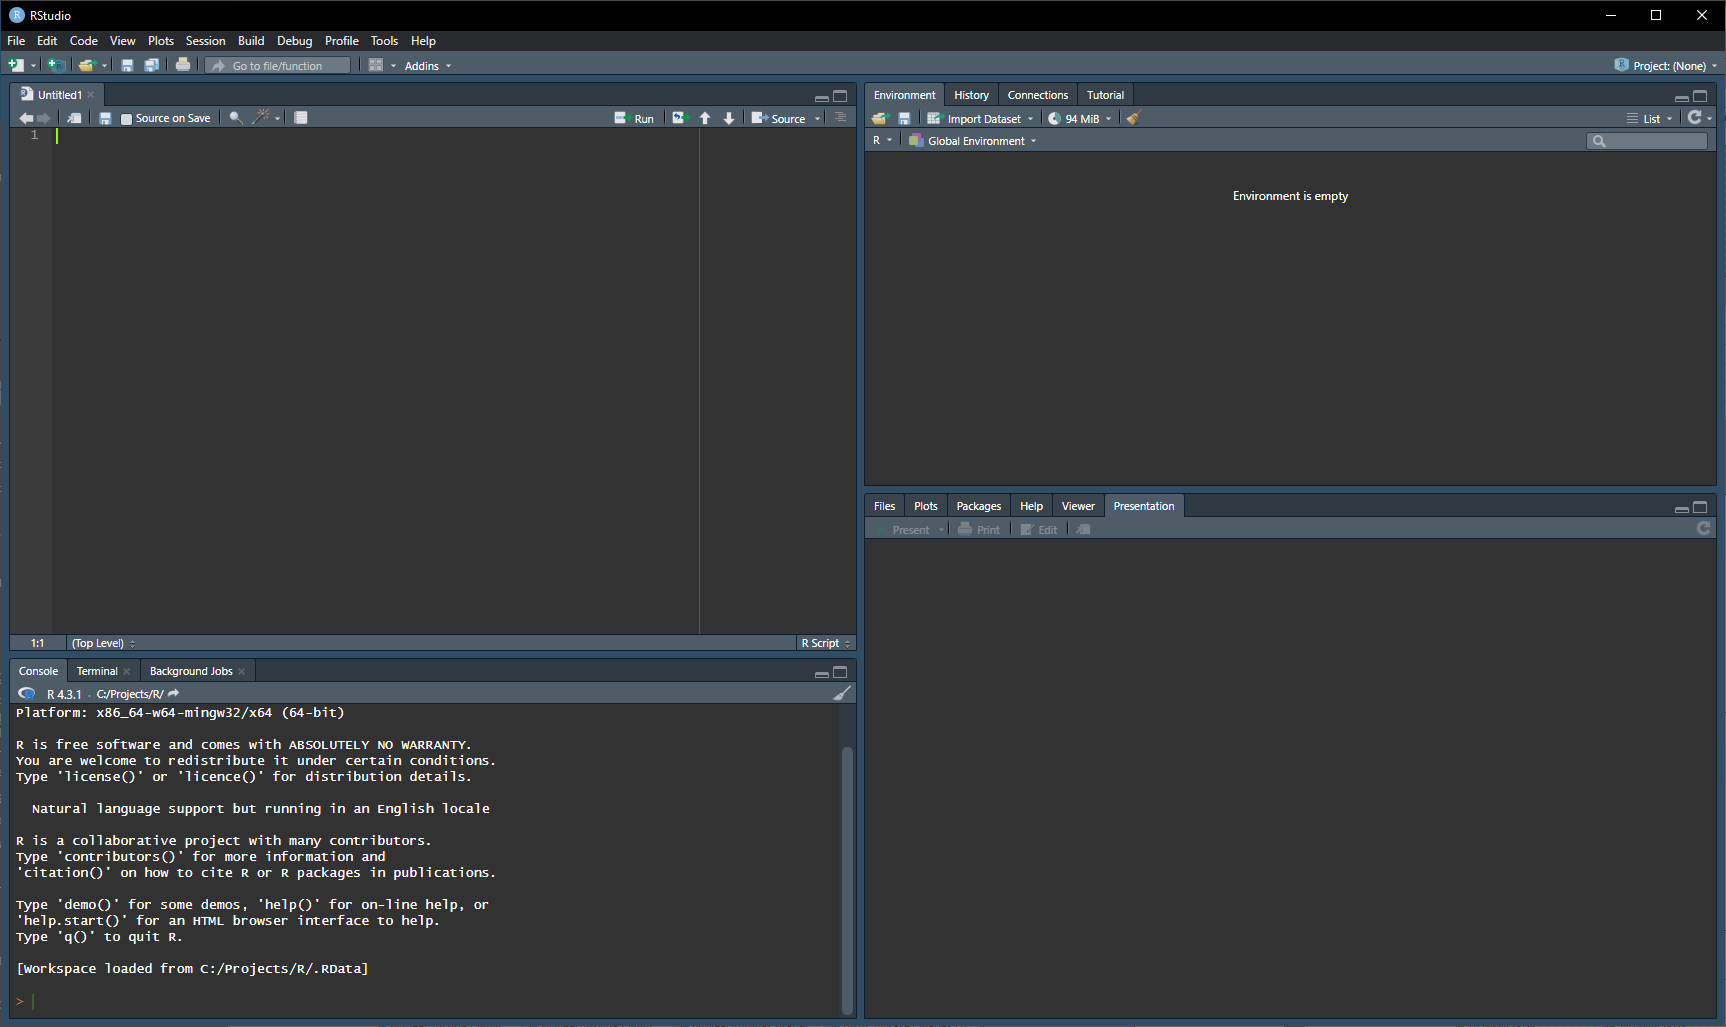
When you start RStudio, the interface shows three primary panes. The pane on the left is the console, the top right has functions for managing variables and data, and the lower right has functions for managing files, plots, packages, and the help functions.

Does the default light theme for RStudio scorch your retinas? You can switch to a dark theme like the one in these examples.
Go to the Tools menu and select Global Options. On the left side of the window that opens, select Appearance. The bottom part of the window has a list of themes you can select, with a preview shown on the right side. The theme used in these examples is Idle Fingers.
Console and Terminal
The Console is an instance of R and allows you to run R commands using the command line interface (CLI).
The Terminal is a regular Windows command prompt which is mostly useful for advanced users.
Environment, History, and Connections
The Environment tab shows you all of the variables and functions that have been assigned or declared in the current R session. There are also buttons for loading and saving an environment from/to a file, importing data using a wizard, and clearing out anything in the environment.
The History tab allows you to see all of the commands that have been run at the command line. There are also buttons for loading and saving a history from/to a file, sending a command in the history to the console or to a script, and deleting selected parts of the history or all entries.
The Connections tab is an advanced feature for making database connections such as ODBC or Apache Spark.
Files, Plots, Packages, Help, and Viewer
The Files tab allows you to browse files similar to Windows Explorer. The tab also has functions for changing the current working directory (under the "More" menu) which can be helpful for working with files on disk.
The Plots tab will let you see any plots you have created and has tools for scrolling through the created plots, opening a zoom view, exporting the plots as images, and deleting plots.
The Packages tab lets you view the installed packages, activate or deactivate them, install new ones, and update installed ones.
The Help tab lets you view search and use R's fantastic documentation.
The Viewer tab is an advanced feature for viewing local web content, typically used with R packages like Shiny.
Creating a Script
Most work in R is typically done in a script, which is a file that contains a workflow of commands so that an analysis can be repeated.
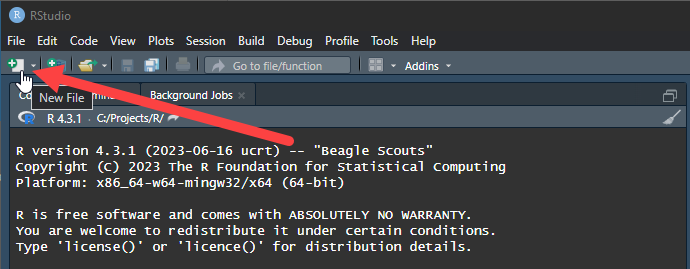
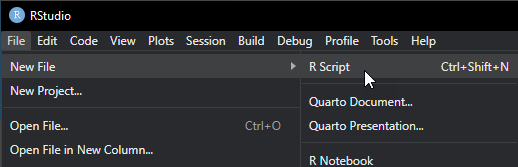
Create a new script by selecting the "new file" button (a white rectangle with a green circle containing a white plus sign) and in that drop-down menu, selecting the option for "R Script."
After creating a script, a new pane will appear in the upper left, moving the console/terminal pane to the lower left:
Script Pane
The script pane lets you enter R commands that do not immediately run, and is useful for logging the workflow for an analysis. The pane has several important features.
The arrows on the left are for scrolling through multiple scripts if you have them open.
The rectangle with the arrow icon moves the script to a pop-up window.
The save icon saves the file to disk.
The option for "Source on Save" toggles whether or not the entire script should be sent to the console or not when the file is saved. The default is off.
The magnifying glass opens the find/replace functions.
The magic wand menu is for code diagnostics, and is an advanced feature.
The two white rectangle icon is for compiling a report if you are using R Markdown (an advanced feature).
The white rectangle with the green rightward arrow is for running the line that the cursor is on, or any lines that are selected. This will send the code to the console and execute it.
The white rectangle with the blue curled arrow and green rightward arrow will re-run the previous code region if you use regions in your code.
The source menu has options for running the entire script: source, which runs the entire script without printing each command in the console, or source with echo, which runs the entire script while printing each command.