Download PDF
Download page Overview of the Software Layout.
Overview of the Software Layout
When you first start HEC-SSP, you will see the main window as shown in Figure 1, except you will not have any study data on your main window. As shown in Figure 1, the main window is laid out with a Menu Bar, a Tool Bar, and four window panes.
The upper right pane (which occupies most of the window area) is the Desktop Area (Referred to as the "Desktop" from this point in the manual). This area is used for displaying maps, data editors, and analysis windows.
The upper left pane is called the Study Explorer. The Study Explorer acts like an explorer tree for the study. The top level of the tree is the study ("SSP Examples" in this example). Below the study is an analysis branch, a data branch, and a map branch. Under the analysis branch, the first level is the type of analysis. Under each analysis type will be the current user-defined analyses for that type. The data branch lists all of the available data sets that have been brought into the current study. Generally, a data set represents a piece of data at a specific location. For example, all of the peak annual flows at a single stream gage would be stored as a single data set. When an analysis is created, the user selects a data set to be used for that particular analysis. The map branch of the tree contains any maps the user has put together for the study. By default there is automatically a "Base Map" listed under the maps folder.
The lower left pane, and associated tabs, also belongs to the study explorer. This window is used to show additional information about items selected in the study explorer, such as last compute time and last modified time. The tabs are used to switch to different views within the study explorer window. The first tab, labeled Study, shows the explorer view of the study. The second tab, labeled Maps, lists the available maps and map layers associated with each map. The last tab, labeled Files, shows all of the files that make up the current study.
The lower right pane is called the Message Window. This window is used to display messages from the software as to what it is doing. 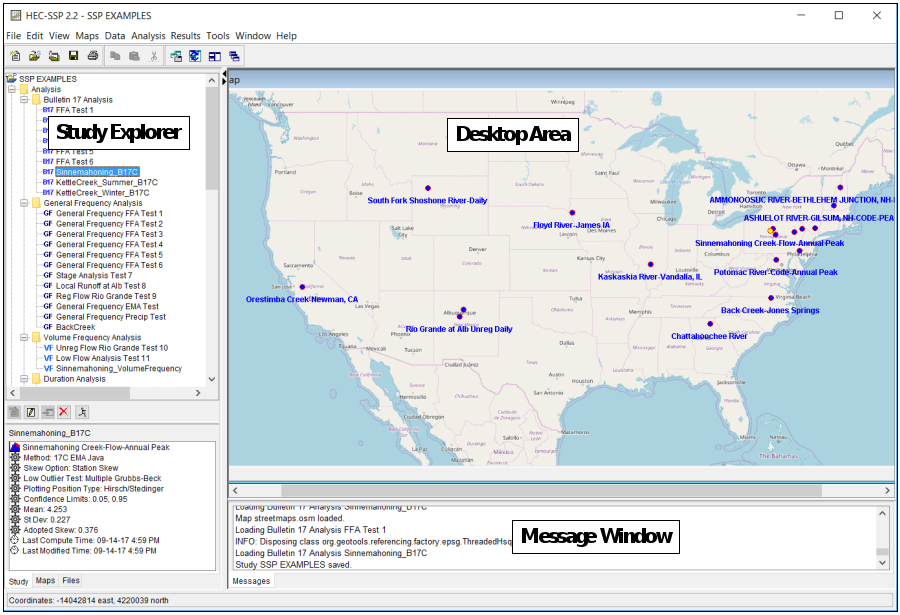
At the top of the HEC-SSP main window is a Menu bar with the following options:
File: This menu (Figure 2) is used for file management.
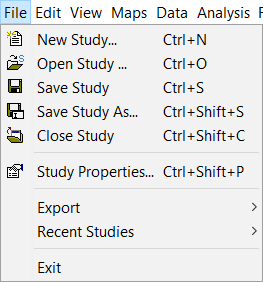
Options available under the File menu include New Study, Open Study, Save Study, Save Study As, Close Study, Study Properties, Export, Recent Studies, and Exit. The Study Properties option is used to describe the study. The Export option is used to export HEC-SSP results, stored in the study DSS file, to another DSS file. The Recent Studies option lists the most recently opened studies, which allows the user to quickly open a study that was recently worked on.
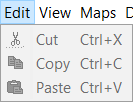
Edit: This menu (Figure 3) is used for applying the Cut, Copy, and Paste clipboard features to data in editable fields and tables.
View: The View menu (Figure 4) allows the user to control display of the toolbars and the study windows.
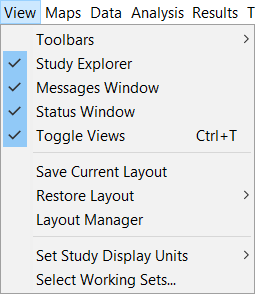
The user can also toggle between viewing all of the panes or just the Main View Pane. The View menu also has options for saving the current layout (currently opened windows and their sizes and locations) and restoring a previously saved layout. The Set Study Display Units option allows the user to switch output between English and metric units.
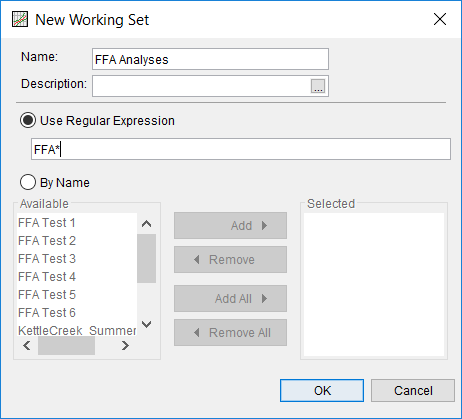
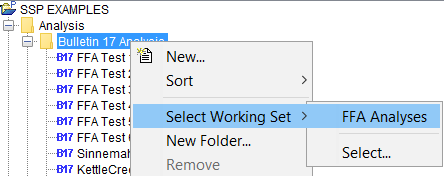
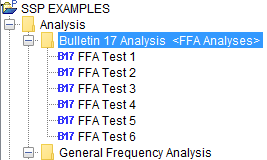
The Select Working Sets menu option allows the user to group items in each folder and then display only those items in the user interface. For example, Figure 5 shows the Bulletin 17 folder in the study explorer. The Edit Working Set editor, Figure 6, was used to group all Bulletin 17 analyses that started with "FFA" into one working set. The working set was named "FFA Analyses". This working set was activated by right clicking on top of the Bulletin 17 folder in the study explorer and selecting Select Working Sets | FFA Analyses, as shown in Figure 7. Only the Bulletin 17 analyses within the working set will then be displayed in the study explorer, as shown in Figure 8. To display all Bulletin 17 analysis, right click on top of the Bulletin 17 folder in the study explorer and select Select Working Sets | No Working Set. 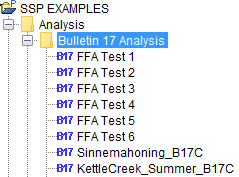
The user may also prefer to group multiple analyses of the same type together using folders. Folders can be created by right clicking on the analysis type of interest and selecting New Folder… as shown in Figure 9.
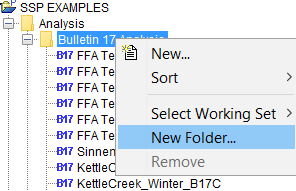
After the user has named the folder, analyses can be added to the new folder by left clicking on the analysis, holding down the left mouse button, dragging the analysis to the newly created folder, and releasing the left mouse button.
Maps: This menu (Figure 10) is used to set the Default Map Properties (Coordinate system, extents, etc…), define a new map, add map layers to the study, and remove a map.
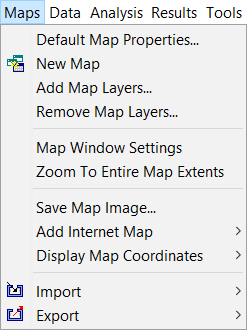
Additionally, this menu has the following options available: Map Window Settings (allows the user to turn map layers on and off), Zoom To Entire Map Extents, Save Map Image, Add Internet Map, Display Map Coordinates, Import, and Export. The Zoom To Entire Map Extents option displays the entire set of map layers within the map window. The Save Map Image option can be used to save the current view of the map to a file. The Add Internet Map option can be used to display (or remove) an internet map using Open Street Maps. The Display Map Coordinates option can be used to change between the Watershed coordinates or an Internet projection (i.e. Web Mercator) to allow for the faster display of internet maps.
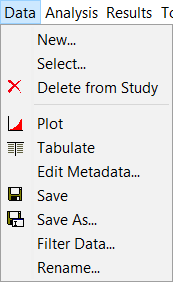
Data: The Data menu (Figure 11) allows the user to define a new data set, open the metadata editor, and delete any existing data sets from the data list. Other options include plotting, tabulating, saving data, saving data using a new name, filtering an existing data set to create a new data set, and renaming a data set.
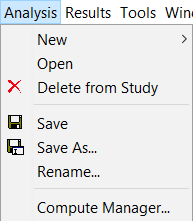
Analysis: The Analysis menu (Figure 12) is used to create the various statistical analyses available in the software. Each statistical analysis is saved as a separate file containing the information that is pertinent to that specific analysis type. The current options under this menu item include New, Open, Delete from Study, Save, Save As, Rename, and Compute Manager. The compute manager allows the user to select one, several, or all of the analyses, and then have them all computed as a batch process.
Results: The Results menu (Figure 13) allows the user to graph and tabulate any of the existing analyses that have been computed.
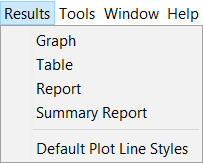
Additionally, the user can request to view the report file from an analysis. Users must select at least one analysis in the Study Explorer before selecting Graph, Table, Report, or Summary Report. If more than one analysis of the same type are selected (this is accomplished by holding down the control key while clicking on the various analyses), the Graph and Summary Report options will include results from all analyses that are selected. The Default Plot Line Styles menu option lets the user change the default line styles applied to different data types that are plotted in a graph. For example, the user can change the default line style for high outliers so that they are displayed as black triangular data points when a plot is opened.
Tools: The Tools menu (Figure 14) includes HEC-DSSVue, Plot Probability Lines, Options, Console Output, and Memory Monitor.
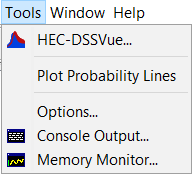
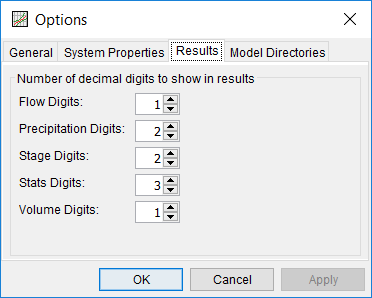
The HEC-DSSVue option brings up the HEC-DSSVue program and automatically loads the current study DSS file. HEC-DSSVue is a DSS utility to tabulate, graph, edit, and enter data into DSS. The Plot Probability Lines option opens an editor, shown in Figure 15, that lets the user add, delete, or edit the probability lines and axis labels that are displayed in all frequency curve plots. Changes made within the Plot Probability Lines editor will be saved to the computer's registry such that any changes will be retained between sessions. The Options menu item opens the Options editor that allows the user to set default HEC-SSP options. The Results tab in the Options editor, shown in Figure 16, allows the user to set the number of decimal digits that are displayed for each type of result. 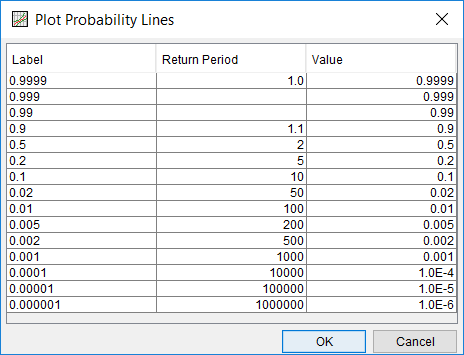
Window: This menu (Figure 17) includes Tile, Cascade, Next Window, Previous Window, Window Selector, and Window.
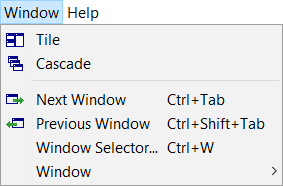
These options are used to control the appearance of the windows in the Desktop area. When more than one window is open (such as a data importer, and various analysis windows), these menu items will help the user organize the windows, or quickly navigate to a specific window. The Tile option can be used to organize all of the currently opened windows in either a vertical or horizontal tile. The Cascade option puts one window on top of the next in a cascading fashion. The Next Window option brings the next window in the list of currently opened windows to the top. The Previous Window brings the last window that was on top back to the top. The Window Selector option brings up a pick list of the currently opened windows and allows you to select the one you want. The Window option has a sub menu list of all the opened windows and allows you to select one.
Help: This menu (Figure 18) allows the user to open the HEC-SSP User's Manual, install example data sets, read the terms and conditions of use statement, and display the current version information about HEC-SSP.
