Download PDF
Download page Basic OSI Setup.
Basic OSI Setup
Before an OSI can be set up in an alternative, a simulation using the alternative must be successfully computed. Then, after opening the OSI, the process for configuring it involves two basic steps—adding a tab and adding one or more variables to the tab.
CWMS/RTS—You can also configure (and use) the OSI from a CAVI Forecast. Just click on the ResSim alternative of a computed forecast run, then click the Operations Support action button.
Compute the Alternative
- Open (or create) a simulation in the Simulation module of ResSim.
- Select an alternative to configure the OSI within. If the alternative has not been computed, compute it.
Open the OSI
- Select Operations Support Interface from the bottom of the Simulation menu. The OSI will open as illustrated in "Figure: Operation Support Interface - Unconfigured (Blank)".
Add a Tab
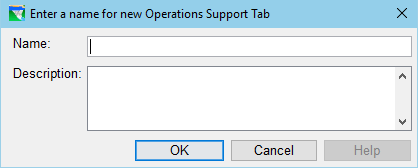
Figure: OSI New Tab Name Dialog
- Select Add Tab from the Edit menu. A name dialog will open ("Figure: OSI New Tab Name Dialog"). Enter a name (and an optional description) and click OK.
- The newly created tab will appear directly below the menu bar, along with an empty Sample Plot and Table Panel as illustrated in "Figure: Operation Support Interface with a New Tab Added - Annotated".
You can add additional tabs as needed; the only limit on the number of tabs you can add is the number you can keep track of—so don't go overboard. Other tab management functions available on the Edit menu:
Rename—you can rename a tab by making it active (by clicking on it), then selecting Rename Tab from the Edit menu.
Rearrange—you also rearrange your tabs. Select Order Tabs from the Edit menu, then use the List Order Editor to re-order them.
Remove—you can delete a tab from the OSI by making it active, then selecting Delete Tab from the Edit menu. You do not need to delete the variables from a tab before deleting the tab, but be careful, there's no UNDO.
Add a Variable
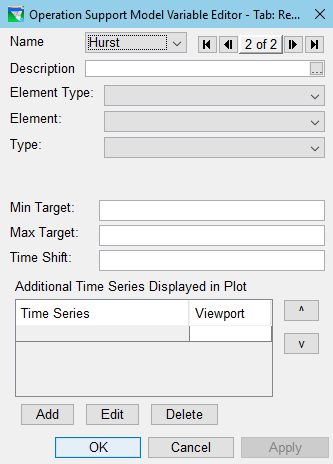
Figure: Variable Editor Dialog Box
- Select Add Variable from the Edit menu.
- A name dialog will open; enter a Name and an optional Description and click OK.
The OSI Model Variable Editor will open ("Figure: Variable Editor Dialog Box").
Select the Element Type. Your choices include:
- Junction
- Reservoir
- Reach
- Diversion
- Select the Element. These are the elements created in the reservoir network that the active alternative is based on.
- Select the Variable Type. The Variable Types or categories were described in "". The list of available Variable Types is dependent on the selection of Element Type.
Depending on the Element and Variable Type selection(s), additional parameters may appear in the editor. These parameters affect the behavior or computation of the variable. "Table: OSI Variable Types and their Additional Parameters" shows the list of available Variable Types per Element Type and their Additional Parameters.
Table: OSI Variable Types and their Additional Parameters
Element Type
Variable Type
Additional Parameters
Junction
Local Inflow
Local Flow
Recession Method
Recession Constant
Max Recession Period (days)Computed Parameter
Computed Time Series
Reservoir
Reservoir Release
Reservoir Release From
Elevation Target
Computed Parameter
Computed Time Series
Reach
Computed Parameter
Computed Time Series
Diversion
Diversion Override
Computed Parameter
Computed Time Series
- After configuring the OSI Variable (all selections made in the upper portion of the OSI Model Variable Editor), click Apply to save the variable settings but keep the editor open.
Configure the Plot Panel
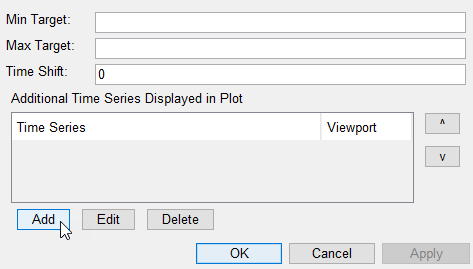
Figure: OSI Variable Editor - Plot Panel Configuration Options
The lower portion of the OSI Model Variable Editor ("Figure: OSI Variable Editor - Plot Panel Configuration Options") provides options for configuring the Plot Panel of the OSI when displaying your variable. These options include:
- Min Target—denotes a user-entered minimum target for the Variable with a marker line.
- Max Target—denotes a user-entered maximum target for the Variable with a marker line.
- Time Shift—applies a time offset (shift) in the plot. This may be useful when plotting additional time series with your variable—such as a downstream flow.
- Additional Time Series Displayed in Plot—this table shows the list of time-series datasets that will display with the OSI variable in the Plot Panel. Use the Add, Edit, and Delete buttons below the table to manage the entries in the Additional Time Series… list. For example, to Add one or more ResSim output time series to be plotted with the variable in the plot panel:
Click the Add button. This will open the Independent Variable Definition dialog ("Figure: Independent Variable Definition Dialog"). (If the Independent Variable Definition dialog doesn't appear, click Apply, then click Add again.)
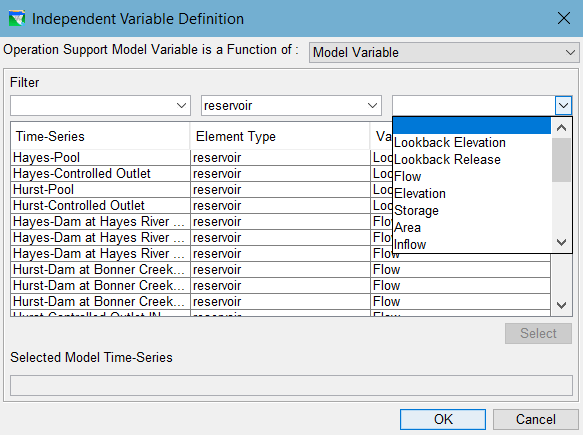
Figure: Independent Variable Definition Dialog
Use the Independent Variable Definition dialog to select a variable to include with the plot of the OSI variable. Detailed instructions for using the Independent Variable Definition dialog are available in "The Independent Variable Definition Dialog".
If more than one time series is added to Additional Time Series… table, the display order can be changed by highlighting a time series in the table and using the arrows buttons to move the selected entry higher or lower in the list ("Figure: OSI Variable Editor—Rearranging Display Order of Additional Time Series").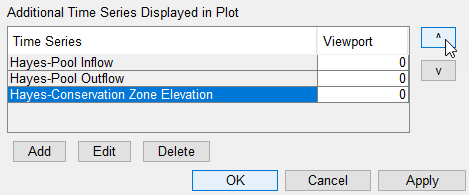
Figure: OSI Variable Editor—Rearranging Display Order of Additional Time Series
When finished configuring the OSI variable, click OK to accept the settings and close the OSI Variable Editor.
"Figure: OSI Plot Panel for a Variable with Additional Time Series Selected" shows the plot panel of the OSI tab for the variable configured to use the additional time series shown in "Figure: OSI Variable Editor—Rearranging Display Order of Additional Time Series". Since the parameter types of one or more of the additional time series had a different parameter than that of the OSI variable, an additional plot viewport was automatically added to display the different parameter type. Note—the vertical axis in each viewport starts at zero by default. This may be inappropriate for some of the plotted data so be sure to zoom in on the axis to show a valid plot of the data.
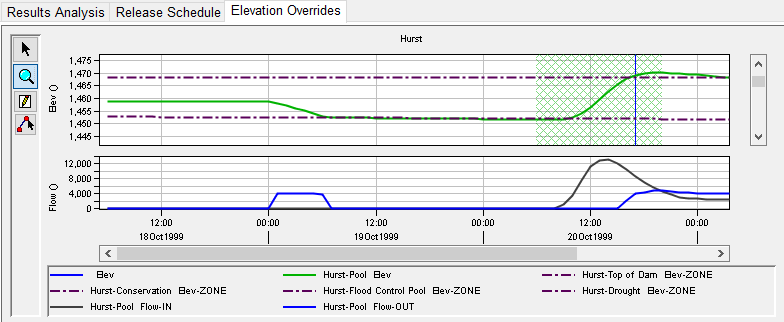
Figure: OSI Plot Panel for a Variable with Additional Time Series Selected
Save the OSI Configuration.
When finished defining the tabs and their variables, select Save from the OSI's File menu to save the OSI configuration. Then close the OSI.
To retain the OSI configuration for use in another simulation, save the alternative to base by using the Save to Base Directory… option in the alternative's context menu in the Simulation Control Panel.
The OSI configuration is saved as part of the data of an Alternative. This means that the OSI can (and must) be configured separately for each new alternative. However, if an alternative is created by using SaveAs to create a copy of an existing alternative that already has an OSI configuration, the new alternative will include the OSI configuration from the original alternative.