Download page Using the OSI for Reviewing Results.
Using the OSI for Reviewing Results
Depending on your model, you probably have at least a few locations and parameters whose results should be reviewed to determine how well your model is performing or if your operations are meeting your objectives. With the OSI, you can assemble these variables on one (or more) tabs to make the review of the results quick and easy.
For Example:
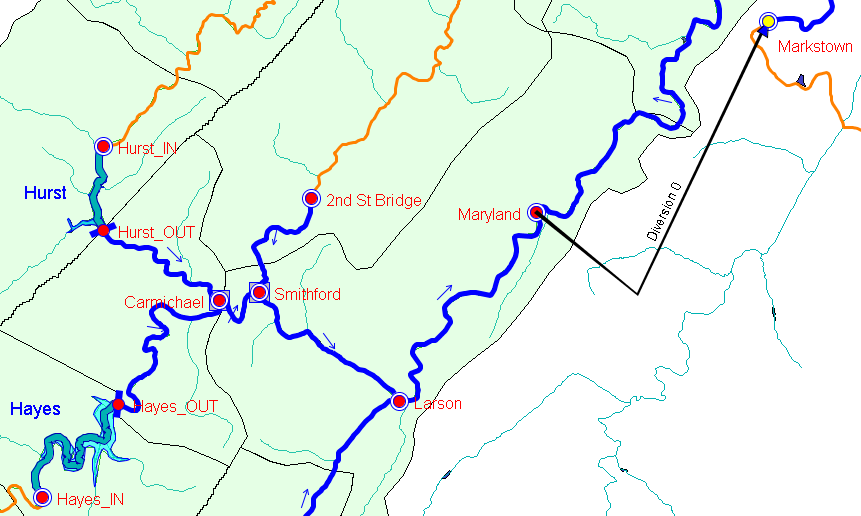
The Hayes Basin model ("Figure: An Example Watershed - Hayes Basin") has two reservoirs, Hayes and Hurst, and two downstream control points, Carmichael and Smithford. Further downstream is a water supply withdrawal location at Maryland.
Figure: An Example Watershed - Hayes Basin
We chose to create a tab to monitor results at the control points and the withdrawal location and we named it Results Analysis. On this tab we added three OSI Variables to display the:
Carmichael Flow
Smithford Flow
Maryland Withdrawal Flow.
But the flow results at a location usually cannot stand alone. We needed additional information to analyze the results at the three locations including:
the flow constraints at the control points
releases from the reservoirs
the local inflows
and, for the diversion,
the inflow to the Maryland junction, and
the withdrawal demands.
To view the additional information, they can either be represented with additional OSI Variables or they can be plotted as "Additional Time Series…" with one or more of the first three identified Variables. We chose the latter as you will see below.