Download PDF
Download page Yield Analysis Summary Report.
Yield Analysis Summary Report
While the reservoir plot showing storage levels and releases is the first and most important result to study, ResSim also creates a Yield Analysis Summary report when a Yield Alternative type has been computed. The Yield Analysis Summary can be accessed from the Reports menu of the Simulation module. From the Reports menu, select Storage Yield Analysis > [yield alternative name] > Output Summary Report ("Figure: Reports menu - Yield Analysis Report Option").
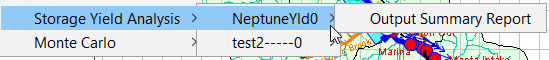
Figure: Reports menu - Yield Analysis Report Option
The resulting Yield Analysis Summary report ("Figure: Yield Analysis Summary Report") includes Simulation Run identification information at the top followed by an Iteration Summary table with demand estimate scaling factors and simulation convergence results per iteration.
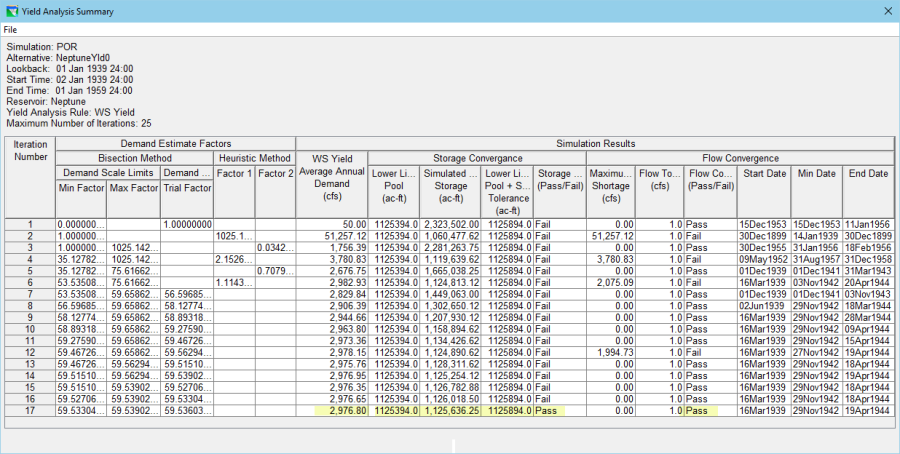
Figure: Yield Analysis Summary Report
The Simulation Run identification information includes:
- The Simulation name,
- The Alternative name,
- The Simulation Time Window: Lookback, Start, and End Dates and Times,
- The Reservoir name for which yield was calculated,
- Yield Analysis Rule name, and
- The Maximum Number of Iterations setting.
The Iteration Summary table has a row for each compute iteration describing the progress toward convergence of flow and storage. The results describe the scaling factors for the demand rule, resulting storage pools, flow and storage shortages or excesses, critical period dates, and whether the iteration passed or failed the flow and storage tolerances. There are two sets of columns:
- Demand Estimate Factors—this set of columns is broken into two subsections that detail the two search methods and their search limits and/or scaling factors used to adjust the demand estimates.
- Bisection Method—the data list includes Demand Scale Limits (Min and Max Factors) and the resulting Trial Factor. The Trial Factor is the bisection (average) of the Min Factor and Max Factor, and it is the value used to scale the initial demand value of the rule. (The first iteration uses the initial demand value with a trial factor of 1.0.)
- Heuristic Method—these columns list the scaling factors used by this method. The heuristic method scaling factors are applied to the previous demand estimate, rather than the initial demand estimate. If the previous demand estimate was too small, the new scaling factor used is expressed under the Factor 1 column, and if the previous demand estimate was too large, the new scaling factor is listed in the Factor 2 column.
- Simulation Results—this set of columns is broken into three subsets of columns:
- WS Yield Average Annual Demand—the demand value selected for that iteration. The demand value represents the constant flow rate of the rule (or the average value if the rule criteria is time-varying). It is calculated using either the initial (bisection method) or previous (heuristic method) demand value multiplied by the current scaling factor.
- Storage Convergence—these columns include:
- Lower Limit of Con Pool—the value of the lower storage limit of the conservation pool, as defined in the Yield Analysis tab of the Alternative Editor. This value does not change across iterations. If the lower limit zone varies seasonally, the lowest value of the seasonal pool is considered the lower limit.
- Simulated Minimum Storage—the minimum storage reached during that iteration.
- Lower Limit of Con Pool + Storage Tolerance—the maximum volume of water that can be left in the reservoir that will satisfy the convergence tolerance when the simulated minimum storage is reached. This value defines the upper limit of the storage tolerance and does not vary across iterations.
- Storage Convergence Test (Pass/Fail)—The storage convergence test passes when the minimum simulated storage falls within the storage tolerance. The storage convergence test fails when the minimum simulated storage falls below the Lower Limit of the Con Pool, or when the minimum simulated storage is greater than the Lower Limit of the Con Pool + Storage Tolerance.
- Flow Convergence—these columns include:
- Maximum Demand Shortage—the greatest shortage to the demand over the period of record. If demand was always met during an iteration, the maximum demand shortage will be zero.
- Flow Tolerance—Maximum allowable shortage. This value does not change across iterations.
- Flow Convergence Test (Pass/Fail)—The flow convergence test passes when the maximum demand shortage is zero or below the flow tolerance.
- Start Date—the date on which the critical period began—when the pool was last at the top of the guide curve before reaching the minimum storage.
- Min Date—the date when the pool was at its minimum value.
- End Date—the end of the critical period—when the pool has fully recovered and is again at the top of the guide curve.