Event Scenario Modeling
Workshop Data
Project Files
Download the Initial Project Files here. Unzip in the C:\CWMS_Class directory. CWMS 3.5 was used to create the workshop files and instructions.Background
Place yourself in the shoes of a water manager in California during a flood event in February of 2019. The Russian River experienced some significant precipitation in the last two weeks, upwards of nearly 12 inches in some parts of the basin. There is more rainfall expected from atmospheric rivers that might exceed what has already fallen in the Russian River basin.
Objective
In this workshop, you will simulate a forecasted rainfall scenario. Your primary concerns include whether or not Coyote Lake pool levels will rise high enough to force spillway releases, how high downstream river levels will reach, and what emergency actions (if any) will need to be triggered.
Tasks
- Launch the CAVI, log into the Local server, and open the Workshop_HEC_RussianRiver watershed.
- Access the Data Acquisition module and review data availability, in particular the Reservoirs, and Flow data.
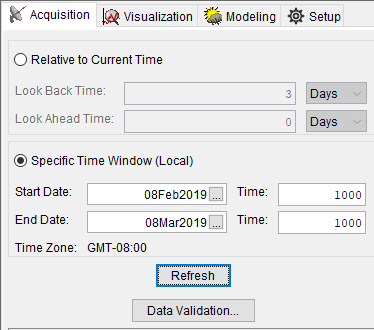
- Review the time series data, animate the gridded precipitation, and verify that there are no issues with the observed data. Set a specific time window to correspond to the forecast you will create below.

Where do you see missing data? Is that data required to run the forecast?
There is some missing stage, and flow data at various locations along the Russian River.
The data is not required to run the forecast, as the stage and flow data would be used for calibration purposes only. If using interpolation methods, this will impact model results but not stop the model from running. If using a gridded precipitation product, the missing gage data will not impact the model results.
- From the Modeling tab, open the existing forecast Event Scenario Modeling. The time window should be as follows:
Forecast Time: 19Feb2019-1000
Extract Start: 08Feb2019-0000
Start Time: 08Feb2019-0000
End Time: 08Mar2019-1000 - Review the results, answer the questions below, and be prepared for a group discussion in the next half-hour or so to decide on potential decisions and actions.
How well did the HEC-HMS model perform in the observed period? Were parameter or initial condition adjustments necessary to calibrate the model?
The HEC-HMS model performed okay. At Warm Springs inflow, the computed inflow volume was less than the observed volume, we adjusted the constant loss parameter to increase volume and better match the observed reservoir elevation.
Look at the HEC-ResSim results to determine how high the reservoir pools reach at Warm Springs and Coyote. Will they spill?
Coyote Peak Elevation: 754 ft.
Warm Springs Peak Elevation: 471.9 ft.
Neither project reached spillway flow. Answers will vary but should be within range of the above values.
How high did the flood stages reach at Hopland, Healdsburg, and Guerneville (view HEC-RAS stage hydrographs)? Review the flood inundation map in RAS Mapper. Is there out of bank flow at these locations?
By plotting the HEC-RAS stage and flow hydrographs from the Reports tab, you can determine peak stages at the three locations. In RAS Mapper you can plot the inundation results against satellite imagery. Since these stages are directly from RAS the datum is NAV88.
Hopland gage : 522 ft (significant out-of-bank flows occurring just downstream)
Healdsburg gage: 110 ft (residential, commercial and agricultural flooding)
Guerneville gage (Hacienda Bridge): 62ft, (widespread flooding, the city is partially inundated)
Answers could vary depending on what changes were made to HEC-HMS and HEC-ResSim.
Were any action stages triggered? (Hint - use the HEC-FIA model's Impact Response Report)
Healdsburg: Major to disastrous flooding
Hopland: Highway 175 closed near Russian River, flooding of farm lands and road closures
Guerneville: Flood of Record, most areas are impassable
Are there potential future issues that might require changes to the reservoir releases? Could any of the changes you considered worsen or mitigate the flooding downstream?
The reservoirs are operating to store water and prevent downstream flooding by reducing outflows during the forecasted period. If there are known issues with the dams or the uncontrolled spillways, this could impact how the reservoirs operate.
Solution Files
Project Files
Download the Solution Data here if you would like the watershed and forecast with the full solution.