Managing HEC-MetVue Model Alternatives
HEC-MetVue model alternatives are derived from the project, and each project follows this hierarchy:
- Project: Contains global settings for the watershed.
- Sessions: Represent model alternatives in HEC-RTS (each session is treated as a model alternative).
- Map Windows: Contain settings for input data and basin average maps.
This guide will teach you how to import a project, create new model alternatives, and edit model alternative settings.
Importing an HEC-MetVue Project
To import an existing HEC-MetVue Project:
Go to the Setup tab.
In the Watershed Tree, right-click the MetVue node and select Import.
- From the Open MetVue Project File dialog, brows to and select the desired project file.
- Click Open.
During import:
- Each Session becomes a model alternative.
- The project file is copied into /watershed/MetVue and renamed to match the watershed.
- Basin average maps are copied into /watershed/MetVue/maps, with relative paths.
- Input data is not copied, as it may be large and typically replaced through the extract process.
- A .mvalt file is created for each Session.
Creating HEC-MetVue Model Alternatives
You can add or remove Sessions and Map Windows within a Project using the HEC-MetVue interface:
- From the Setup tab, launch HEC-MetVue.
- Make edits in the project tree.
- Save and close HEC-MetVue to apply changes.
- Click the MetVue node in the Watershed Tree (Setup tab) to refresh and view new Sessions and Map Windows.
For each added Session, a .mvalt file is created. Unlike during import, basin average maps are not copied, so it’s recommended to manually place them in the /watershed/MetVue/maps directory and use relative paths. For more information on selecting Maps for MetVue see Steps 3: Configure Map Data in Creating an HEC-MetVue Project.
Editing HEC-MetVue Model Alternatives
To edit a model alternative:
- Go to the Setup tab.
- Expand the MetVue node in the Watershed Tree.
- Right-click on the model alternative and select Edit Alternative
- The MetVue Alternative Editor dialog will appear. It includes two tabs:
- Input Settings
- Output Settings
- After making changes, click Apply, then OK to save and exit the dialog.
Input Settings
This tab defines which Map Windows are used for the Lookback and Forecast periods. Each Map Window must have at least one time window (Lookback, Forecast, or both) selected.
Basin Average Maps are configured in the HEC-MetVue standalone application. After editing, changes will appear in the Alternative Editor when reopened.
The TIN/Grid Input section lets you choose input type and criteria:
- DSS: Specify pathnames from a forecast.dss file using A, B, C, and F parts.
- File: Choose input files using file name patterns and duration filters.
- MetVue Interp: Use interpolated point time series data.
TIN/Grid Input settings are initialized during import but may require verification. Ensure all paths are correct and use relative paths for File or MetVue Interp types.
Any setup issues will be flagged in the Warnings box at the bottom of the tab.

Output Settings
This tab is used to define the characteristics of the output datasets, including:
- Output dataset name
- Output time interval
- Output data types: TIN File Generation, DSS Grid Outputs, and Time Series Generation

The Output Data Selection Table is located at the top of the tab and allows you to:
- Name each output dataset
- Assign Map Windows for Lookback and Forecast data sources
Each dataset entry must include:
- Name
- Parameter
- Unit
Output Time Interval
The Output Time Interval setting defines the time spacing of the output dataset—for example, 1-hour intervals. If the input and output time intervals differ, HEC-MetVue will aggregate, disaggregate, or interpolate the input data to match the required output interval.
You can also specify the Output Parameter Type, which describes how the output values are interpreted:
- PER-CUM (cumulative values, typically used for precipitation)
- PER-AVG (period average, such as daily average temperature)
- INST-VAL (instantaneous values, for sub-daily temperature measurements)
Understanding Input Duration vs Output Time Interval
These two settings serve different purposes:
- Input Duration: The length of time a single grid represents (end time – start time)
- Output Time Interval: The time between consecutive output grids (e.g., hourly)
Examples:
- An instantaneous temperature grid has a duration of zero, but the output interval may be 1 hour.
- For precipitation, both the duration and interval are usually non-zero and often the same.
Output Extents
You can define the spatial extent of the output using a shapefile. This limits output to the relevant geographic area and helps avoid generating excessively large grids.
Output Data Types
You can choose one or more of the following output types. While all three can be enabled, it’s best to use only what’s needed to reduce processing time and storage:
- TIN File Generation
- Saves gridded output to a supported file format
- Requires:
- Write Provider
- Grid projection
- Output filename
- You can customize projection settings using the Add/Edit button
- DSS Grid Outputs
- Saves output data to the forecast.dss file
- Requires you to specify:
- Record pathname
- Projection (either SHG or HRAP)
- Time Series Generation
- Generates basin-average time series
- Requires:
- Selection of a Sub-basin Name Column from a shapefile (usually Name)
- This column should match HEC-HMS sub-basin names
- This option is commonly used to pass data to HEC-HMS.
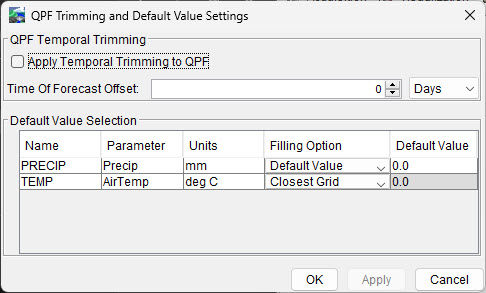
QPF Trimming and Default Value Settings
Accessed via the Options button on the Output Settings tab, this dialog allows you to set QPF trimming and data filling options.
- QPF Temporal Trimming: Automatically set forecast precipitation to zero beyond a specified lead time.
- Default Value Selection: Control how missing data is handled for each output dataset:
No Filling: Leaves missing grids as-is
Default Value: Fills the grid uniformly with a user-specified value
- Closest Grid: Duplicates the closest grid in time
