Random Forest Models
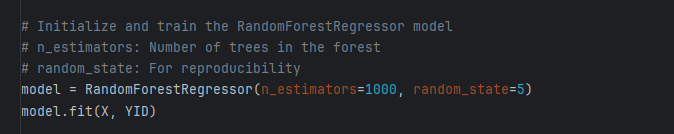
The Scikit-learn Python library contains a Random Forest Regression model (documentation is at https://scikit-learn.org/stable/). Initially, one random forecast model (SimpleMLScript_1) was used to predict all adjustment factors. As shown below, the X array was all the predictor variables (precipitation and temperature) for each of the 32 training events, and the Y array was all 20 adjustment factors from the calibrated models. The 3, 7, 30 and 60 day total precipitation and 7 day average temperature were used as predictor variables in this first ML model.
In the second iteration (SimpleMLScript_2), a separate ML model was developed for Initial Deficit, Constant Loss, GW1 Fraction, and GW2 Fraction adjustment factors, and for each individual Initial Baseflow adjustment factors. The 1-day prior flow seemed like the clear predictor variable for setting the zonal Initial Baseflow adjustment factors; a separate ML model was set up for each initial baseflow zone using the prior day's flow for the reference streamflow gage for that zone. Precipitation, Temperature, and Flow were used as predictor variables for Initial Deficit, Constant Loss, GW1 Fraction, and GW2 Fraction adjustment factors.
The following table shows the importance factors for each predictor variable used in the different ML models. You will notice that the ML model used to predict the Initial Moisture Deficit placed more weight on the 30 day total precipitation, the 60 day total precipitation, the 7 day average flow at Guerneville, and the 7 day average flow at Lake Sonoma.
| XP3 (3 day total precipitation) | 0.01979 | 0.07848 | 0.02438 | 0.03464 |
| XP7 (7 day total precipitation) | 0.02891 | 0.03614 | 0.04162 | 0.06356 |
| XP30 (30 day total precipitation) | 0.15679 | 0.04907 | 0.03834 | 0.02937 |
| XP60 (60 day total precipitation) | 0.16795 | 0.17744 | 0.39115 | 0.40637 |
| XMonth (month of year at the start of the event) | 0.02537 | 0.03243 | 0.06262 | 0.07476 |
| X7Flow_Calpella (7 day average flow at the Calpella Gage) | 0.0777 | 0.25014 | 0.1173 | 0.0524 |
| X7Flow_Hopland (7 day average flow at the Hopland Gage) | 0.07519 | 0.06843 | 0.05556 | 0.0411 |
| X7Flow_Guerneville (7 day average flow at the Guerneville Gage) | 0.16284 | 0.12234 | 0.18348 | 0.19926 |
| X7Flow_LakeSonoma (7 day average flow at the Lake Sonoma Gage) | 0.21373 | 0.04553 | 0.03557 | 0.03933 |
| XT7 (7 day average temperature) | 0.07175 | 0.14001 | 0.04997 | 0.05921 |
Different predictor variables could be explored as well as the "n_estimaters" parameter used to set the number of decision trees within the random forest model. The following tables contain the HEC-HMS adjustment factors for the test events as predicted by the random forest models created using the SimpleMLScript_2 script.
| Initial Baseflow Scale Factor |
|---|
| Zones | 1/2/1997 | 1/22/1997 | 11/12/2001 | 1/1/2002 | 12/17/2002 | 12/27/2002 | 5/20/2005 | 12/21/2005 | 2/24/2008 | 2/18/2009 | 2/23/2009 |
|---|
| Lake Mendocino | 0.57 | 0.31 | 0.1 | 0.53 | 0.36 | 0.3 | 0.45 | 0.12 | 0.27 | 0.26 | 0.27 |
| Hopland | 0.24 | 0.26 | 0.08 | 0.2 | 0.08 | 0.22 | 0.19 | 0.08 | 0.22 | 0.22 | 0.22 |
| Guerneville | 0.05 | 0.05 | 0.01 | 0.05 | 0.02 | 0.05 | 0.05 | 0.02 | 0.02 | 0.05 | 0.05 |
| Lake Sonoma | 0.48 | 0.5 | 0.39 | 0.34 | 0.39 | 0.5 | 0.39 | 0.5 | 0.39 | 0.5 | 0.49 |
| Initial Moisture Deficit Scale Factor |
|---|
| Zones | 1/2/1997 | 1/22/1997 | 11/12/2001 | 1/1/2002 | 12/17/2002 | 12/27/2002 | 5/20/2005 | 12/21/2005 | 2/24/2008 | 2/18/2009 | 2/23/2009 |
|---|
| Lake Mendocino | 0.35 | 0.42 | 2.87 | 0.39 | 2.56 | 0.27 | 1.02 | 1.59 | 0.59 | 0.81 | 0.32 |
| Hopland | 0.45 | 0.56 | 3.01 | 0.58 | 2.68 | 0.5 | 1.14 | 1.94 | 0.69 | 1.01 | 0.43 |
| Guerneville | 0.38 | 0.4 | 2.81 | 0.4 | 2.58 | 0.36 | 1.05 | 1.64 | 0.54 | 0.88 | 0.31 |
| Lake Sonoma | 0.60 | 0.71 | 3.3 | 0.79 | 2.92 | 0.63 | 1.29 | 2.21 | 0.84 | 1.17 | 0.53 |
| Constant Loss Rate Scale Factor |
|---|
| Zones | 1/2/1997 | 1/22/1997 | 11/12/2001 | 1/1/2002 | 12/17/2002 | 12/27/2002 | 5/20/2005 | 12/21/2005 | 2/24/2008 | 2/18/2009 | 2/23/2009 |
|---|
| Lake Mendocino | 0.43 | 0.42 | 0.78 | 0.48 | 0.85 | 0.45 | 0.52 | 0.57 | 0.47 | 0.55 | 0.43 |
| Hopland | 1.45 | 1.22 | 1.81 | 1.43 | 2.47 | 1.19 | 1.58 | 1.74 | 1.3 | 1.71 | 1.27 |
| Guerneville | 0.7 | 0.72 | 1.58 | 0.65 | 2.15 | 0.68 | 0.94 | 1.66 | 0.81 | 1.4 | 0.67 |
| Lake Sonoma | 1.09 | 1.23 | 1.95 | 0.92 | 1.85 | 0.99 | 1.43 | 1.36 | 0.99 | 1.27 | 1.21 |
| Groundwater 1 Fraction Scale Factor |
|---|
| Zones | 1/2/1997 | 1/22/1997 | 11/12/2001 | 1/1/2002 | 12/17/2002 | 12/27/2002 | 5/20/2005 | 12/21/2005 | 2/24/2008 | 2/18/2009 | 2/23/2009 |
|---|
| Lake Mendocino | 0.89 | 0.93 | 0.38 | 0.9 | 0.5 | 0.93 | 0.79 | 0.81 | 0.82 | 0.78 | 0.94 |
| Hopland | 0.83 | 0.98 | 0.39 | 0.81 | 0.37 | 0.81 | 0.76 | 0.59 | 0.78 | 0.66 | 0.91 |
| Guerneville | 0.87 | 0.99 | 0.31 | 0.86 | 0.3 | 0.8 | 0.78 | 0.55 | 0.81 | 0.61 | 0.87 |
| Lake Sonoma | 0.91 | 0.99 | 0.35 | 0.91 | 0.31 | 0.94 | 0.78 | 0.54 | 0.81 | 0.61 | 0.87 |
| Groundwater 2 Fraction Scale Factor |
|---|
| Zones | 1/2/1997 | 1/22/1997 | 11/12/2001 | 1/1/2002 | 12/17/2002 | 12/27/2002 | 5/20/2005 | 12/21/2005 | 2/24/2008 | 2/18/2009 | 2/23/2009 |
|---|
| Lake Mendocino | 1.04 | 1.16 | 0.52 | 1.05 | 0.63 | 1.03 | 1.07 | 0.95 | 1.02 | 0.92 | 1.14 |
| Hopland | 0.93 | 0.99 | 0.43 | 0.9 | 0.52 | 0.95 | 0.8 | 0.77 | 0.8 | 0.72 | 0.94 |
| Guerneville | 0.95 | 0.99 | 0.43 | 0.94 | 0.47 | 0.95 | 0.83 | 0.75 | 0.79 | 0.69 | 0.96 |
| Lake Sonoma | 0.95 | 1.01 | 0.5 | 0.98 | 0.51 | 0.97 | 0.82 | 0.76 | 0.8 | 0.68 | 0.94 |