Download PDF
Download page Configuring a Watershed.
Configuring a Watershed
Now that a watershed has been created you will need to configure the watershed. Configuration steps include: import model alternatives; define the program order; create time series icons; create time series layers; define keys for model alternatives; create forecast runs; setup the model linking between model alternatives in a forecast run; and, manage extract and post groups. The following sections provide further information on the configuration of your watershed.
Import Model Alternatives
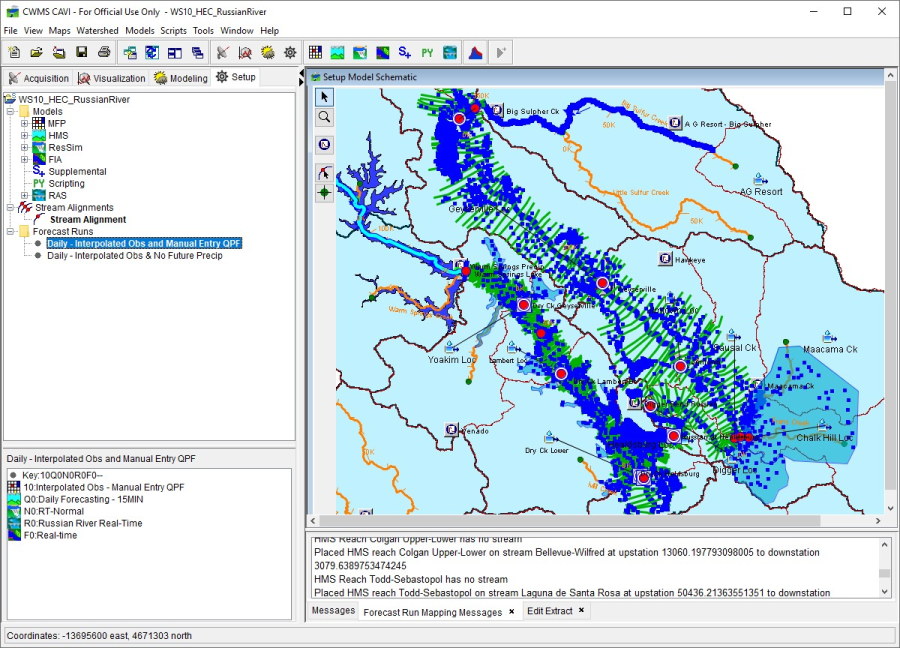
There are two methods for importing model alternatives into your waters. Import a CWMS Version 2.1 Watershed describes importing an entire watershed, which includes the model alternatives. From the Setup module, you can import model alternatives separately for each software application that will be used in your watershed. From the Models menu, point to Import, click on the software application that you want to import a model alternative into your watershed. Another way, is from the Watershed Tree (Figure 15.1), under the Models folder, right-click on the software application that you want to import a model alternative into your watershed. Refer to Model Alternatives and Forecast Runs for further details on the import processes.
Program Order
The order of program execution within CWMS is a fundamental part of the watershed setup, which you define from the Setup module. You need to decide on the program order early on in your setup, and if you change the order after a forecast has been configured, then the flow of data will be disrupted and results will be invalidated. Refer to Program Order for additional details for defining the order for application programs.
Developing Time Series Icons
You develop time series icons in the Map Window of the Setup module in. Time series icon are used by the other modules to show data and information availability. The information can be time series data, images, web pages, webcams, scripts, and document files. You can link time series icons to data from either the CWMS database or from a DSS file. Time series icons provide you easy access to analyzing incoming data and for providing location specific information. Refer to Time Series Icons and Time Series Icons Layers for additional information describing time series icons.
Develop Model Alternatives
A model alternative is a single configuration with a specific set of input and parameters. A second model alternative would be defined by a different configuration or different input or parameters. Since model alternatives do not include time-specific data, you can use a model alternative with any time window. In the Setup module, you will create model alternative keys that will be used in creating a forecast run. Each key is a single alpha-numeric identifier that represents a model alternative. Refer to Model Alternatives and Forecast Runs for additional information on model alternatives.
Create Forecast Runs
A forecast run is a single forecast scenario defined by a specific set of data, information, and model alternatives. You create forecast runs in the Setup module. You use the previously defined model alternative keys to create a forecast run key that consists of a collection of the model alternative keys. Refer to Model Alternatives and Forecast Runs for additional information on forecast runs.
Link Models Alternatives
After a forecast run has been created you need to link the models, which is accomplished through the Model Linking Editor. From this editor you select a forecast run you wish to configure. Then you select each model alternative that is associated with the selected forecast run. For each model alternative you will determine where you will be getting data from another model alternative or from an extract list. Refer to Model Linking Editor for additional information on model linking.
Data Extract and Posting
Once the models have been linked the next step is to configure the data extract groups. A data extract group specifies the location of the gridded and time series data required for the different model alternatives. For example, this could be gridded precipitation data in DSS or observed flow data from the CWMS database. Once you have completed computing your forecast, you might want to post results back to the CWMS database. This task is completed by creating post groups that specify what time series data needs to be save. Refer to Chapter 21 for additional information on the extract and post editor.