Download PDF
Download page Overview - Visualization Module.
Overview - Visualization Module
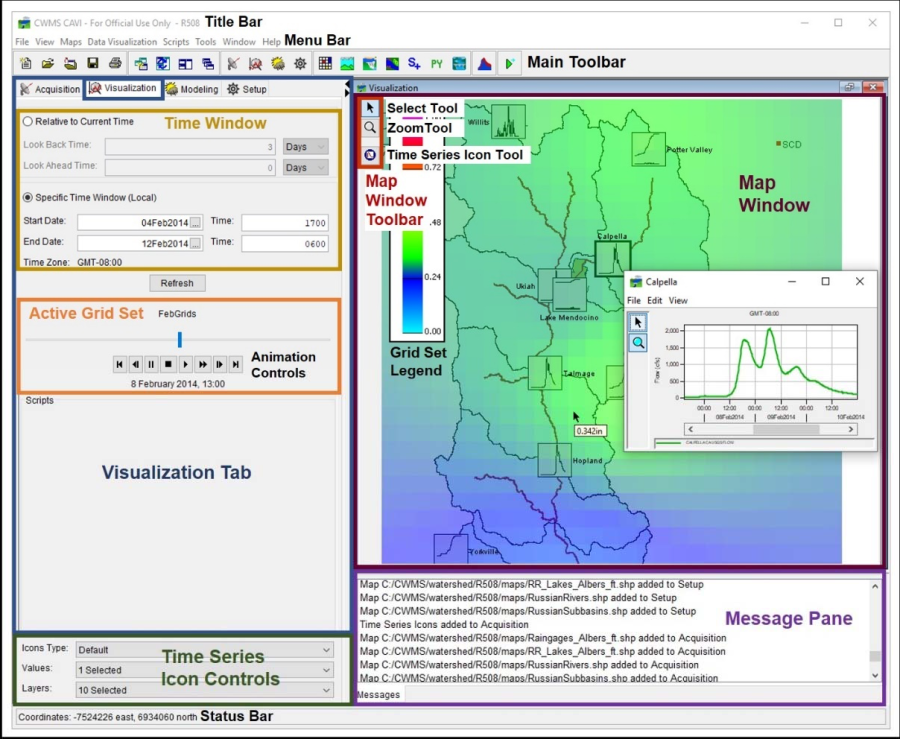
The Visualization module allows you to view current conditions in a watershed and the associated hydrometeorological data in a georeferenced context. From the CWMS CAVI main window, click the Visualization tab, the Visualization module is displayed. A detailed discussion of common screen components is presented in Overview of the CWMS Interface.
Menu Bar
Following is an overview of the menu bar for the Visualization module. The File, View, Maps, Scripts, Tools, Windows, and Help menus are discussed in Overview of the CWMS Interface. The commands available from the menus will allow you to view current conditions in a watershed and the associated hydrometeorological data in a geo-referenced context.
| Data Visualization | This menu provides access to the gridded data, which represents the precipitation for the watershed. The only available command is GriddedData, which includes a sub-menu that allows you to add/edit/delete grid sets (a sequence or time series of grids); cumulate the gridded precipitation for the established time window; provide a list of grid sets, with the active grid set having a check mark; and, do not display grid sets. Available commands are: New Grid Set, Edit Grid Set, Delete Grid Sets, Cumulative Display, Animation Delay, and None. Also, if any grid sets have been created, those available grids sets will be display above the None command. |
Commands
The Visualization tab contains buttons that execute commands specific for the Visualization module. These commands include updating time series icons (Refresh) in the map window and grid animation controls for visualizing gridded precipitation for the watershed.
Map Window
The map window in the Visualization module contains map layers and layers of time series icons that allow you to view visualization processes in a geo-referenced context. The primary function of the Visualization module is to provide you with a meaningful visual representation of your observed data. Threshold color bars or thumbnail plots, which update dynamically to reflect current conditions, are usually used/configured for those time series locations that you watch daily or are of critical importance within your watershed. On the other hand, you might wish time series icons to display as space-conserving graphical images or dots if you are monitoring data acquisition for an entire office. Customizing the time series icon layers is done in the setup module, which is described in Time Series Icons Layers.
In most cases, for the Visualization module, you should configure time series icons to display as threshold color bars. Threshold color bars display current data into multi-colored strips, such as green, amber, and red (colors can be specified by the user), that allow you to quickly home-in on those locations that are exceeding critical threshold limits.
Time Series Icon Controls
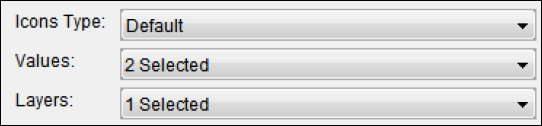
The Time Series Icon Controls allow you to select attributes for the Time Series Icon Layer that are displayed. The time series icon controls are located on the Visualization tab near the bottom of its pane. There are three attributes available: Icons Type, Values, and Layers (Figure 1).

| Icons Type | forces all icons within the map window to display as the selected Icon Type in the list. Selecting the Default option in the list will display the icons as they were set originally during setup (Time Series Icons). |
| Values | allows you to display the time series icon's data as labels, which display next to or on the location of their associated time series icons. For example, you can choose to display the data's total, minimum, and maximums values as labels. Multiple values can be selected at once. |
| Layers | allows you to select the sub-layers that are visible in the map window. Multiple layers can be selected at once. |
By selecting the attributes, you can change how time series icons are displayed within the Visualization module. For more detailed information on how to configure the properties that control the time series icons displayed, refer to Time Series Icons Layers.