Download page Preparing to Monitor Current Conditions.
Preparing to Monitor Current Conditions
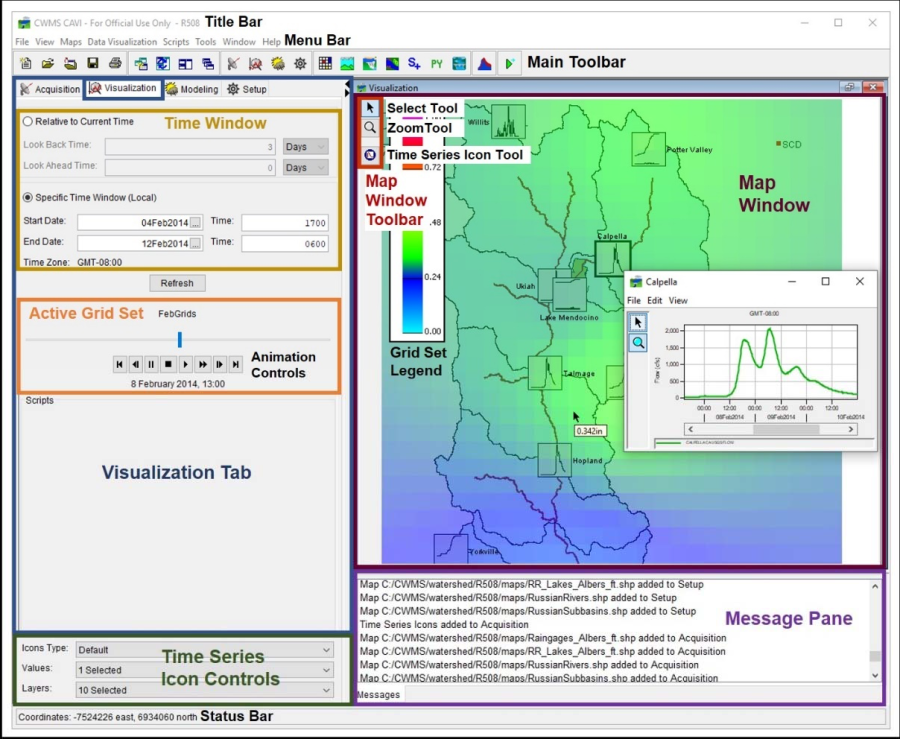
To begin monitoring current conditions in a watershed, you will need to set the time window for viewing and updating the color bars and plot icons in your map display.
Set Time Window
You can either set a specific (i.e., fixed) time window (for reviewing a historical event) or you can set a time window relative to the current time (the default setting, used for monitoring incoming data in real-time).
If you would like to set the Time Window relative to the current date and time, select theRelative to Current Time and enter the Look Back Time and select either Days or Hours as the time unit. Normally you will set the time window to extend backward one to thirty days from the current time. Optionally, you can enter a Look AheadTime and select either days or hours; this allows you to look ahead at data.
Click Refresh (Figure 1) to complete the time window change.
Time Series Icon Shortcut Menu
From the Map Window, the time series icons display, by right-clicking on a time series icon, a shortcut menu will display that allows you to view the data associated with a selected time series icon either in a plot, table, or using Microsoft Excel®. Also, from the shortcut menu you can access the Data Validation Editor (Validate) to edit the data associated with the selected time series icon. Another option is that you can view the legend of the selected time series icon. The shortcut menu is the same for all of the available time series icon types (i.e., for the color bars, thumbnail plots, graphics, or dots).

