The Map Window within the Modeling module contains the model schematic elements for the active forecast in a georeferenced context. In addition, time series icons provide access to model information, including model parameters, or output time series. Time series icons are configured in the Setup module, which is described in Time Series Icons.
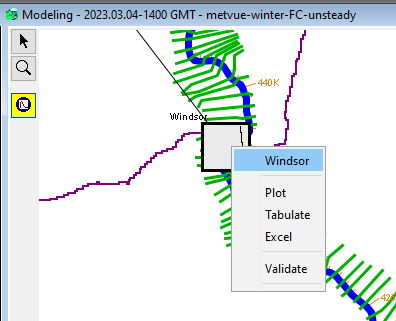
From the Map Window, use the Select tool and right-click on a time series icon to view a shortcut menu. From this shortcut menu you can view the model information and results associated with a selected time series icon in an editor, plot, or table.

Editing Model Elements
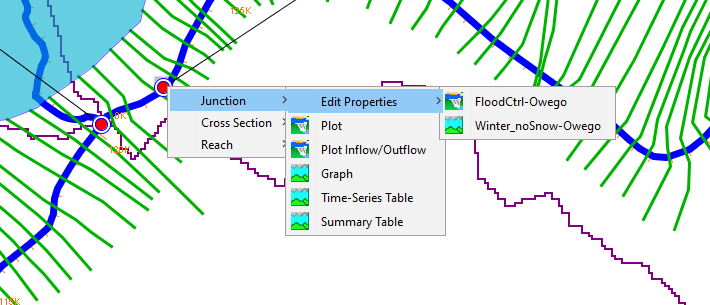
From the Map Window, use the Select tool and right-click on an individual model element. From the shortcut menu, you can edit model elements of the active forecast. In the example shown below, a junction was selected. The Edit Properties menu option includes two model elements, the junction in the HEC-ResSim model (named FloodCtrl-Owego) and the junction in the HEC-HMS model (named Winter_noSnow-Owego). When you select which model you want to edit, a dialog will open allowing you to edit the properties of that element within the native model user interface.

Reviewing Model Results
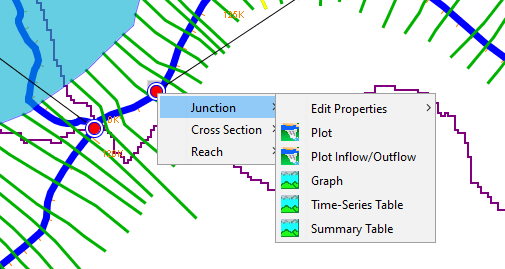
From the Map Window, use the Select tool and right-click on an individual model element. From the shortcut menu, you can view model results of the active forecast. In the example shown below, a junction was selected. The junction exists in both the HEC-ResSim and the HEC-HMS model. You can choose which model output to view by selecting the appropriate option from the shortcut menu.
