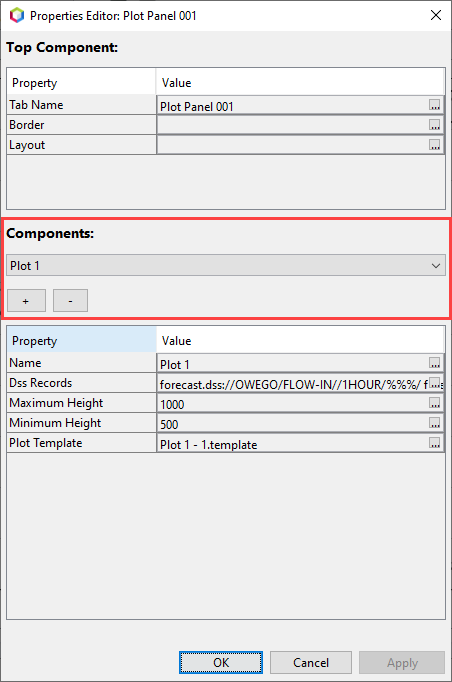
The Plot Panel widget is used to graphically display data within the Dashboard. Once a Plot Panel is added to the Dashboard, you will see a set of blank graphs, as shown below. Right-click on the plot panel tab (denoted as "Plot Panel 001" in this example) and select the Properties option. A Properties Editor dialog will open. To modify the options, select the ellipses on the right side of the Value column.

To add data from an HEC-DSS file to the graph, select the ellipses in the box to the right of Dss Records. A new dialog will open (shown below), allowing you to add records from an HEC-DSS file. Select the Add Records button at the bottom of the window.

In the Browse DSS dialog, navigate to the HEC-DSS file you would like to open via the Open option under the File menu. Once the HEC-DSS file has opened, select the pathnames of interest and click on the Add Pathnames button at the bottom of the dialog.

After you click on the Add Pathnames button to add the records to your plot panel, a dialog box will open asking if you want the model F parts set using relative pathnames.

Selecting Yes will change the F part of the HEC-DSS pathname to percent signs (%) for each model key that would be used (example, for HEC-HMS results the F part would be %% assuming there is only a MFP or a HEC-MetVue alternative before the HEC-HMS model). This use of wildcards allows for the data to switch between forecast alternatives. If you select No when prompted, this will lock in the model key so the data will only be shown for the selected model alternative. If you decide to display alternative A0B0 in the graph and choose not to convert the F-part to relative pathnames, then the graph will only show results for A0B0, even if you switch to alternative A0C0 (the use of %% would allow the table to be updated with the A0C0 results).
Additionally, you can edit the plot panel properties using the icon denoted in the figure below.

A Plot Panel Properties dialog will open. You can edit the line style, labels, and legend from this window. If more than one graph is shown in the panel, the Select Viewport option can be used to move between graphs.

You can display multiple graphs in a single plot. If you select parameters that are different units (flow and elevation, for example), the Dashboard will create different viewports and graph like units together. These can be differentiated in the editor through the viewport option. Additionally, a second set of graphs can be added the the same plot panel. This option can be found under the Properties Editor, shown below. The plus and minus signs allows you to add or remove graphs as needed.