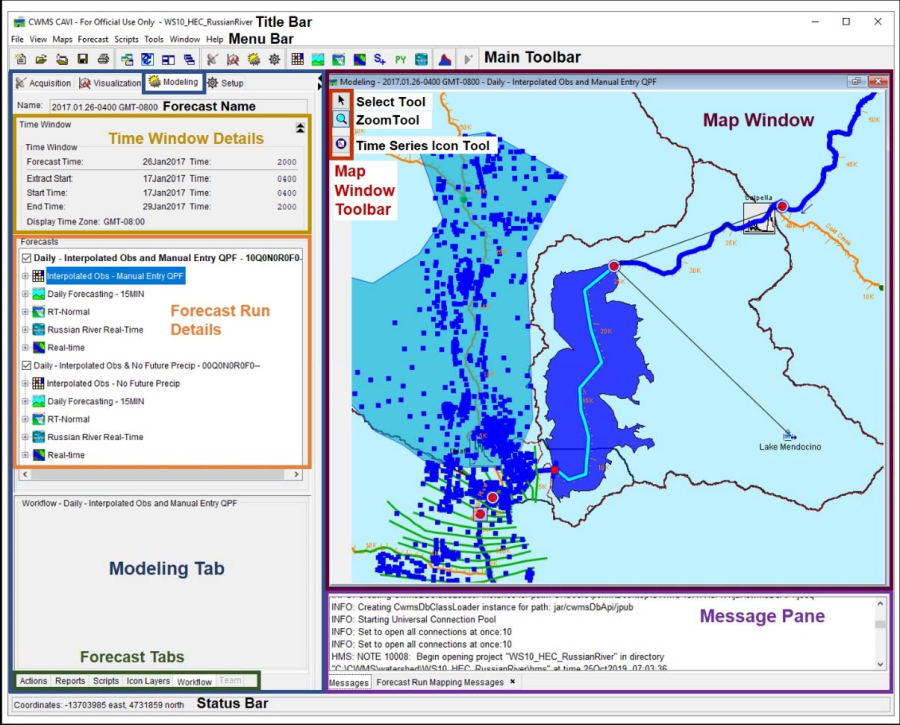
In the Modeling module, the Map Window contains the model schematic elements for the active forecast in a geo-referenced context. In addition, time series icons are available that provide access to additional model data or other time series data. Time series icons are setup in the Setup module, which is described in Time Series Icons.
Time Series Icon Shortcut Menu
In the Modeling module, from the Map Window, click . Right- click on a time series icon, a shortcut menu will display (Figure 1). From this shortcut menu (Figure 1), you can view the data and results associated with a selected time series icon in a plot, tabulate table, or open the Microsoft Excel® application, so you can view data or results in a spreadsheet format.
Edit and Review Results by Model
In the Modeling module, from the Map Window, click . From the schematic, right-click on individual model elements, from the shortcut menu (Figure 2), you can edit and review results for the individual models of the selected forecast.
