Quality color bars allow you to view the quality of incoming data within the time window defined in the Acquisition module. Quality is defined as being one of the following: valid, questionable, rejected, missing, no report, or not checked. You must have quality flags associated with the data sets to use quality color bars.
To edit the colors used for the quality flags:
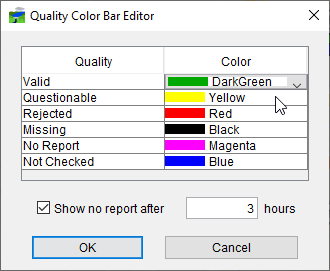
With the Acquisition module active, select Icon Quality Colorsfrom the Edit menu. The Quality Color Bar Editor dialog will open.
To change the color of a quality flag, in theColorcolumn of the table click the drop-down list and a list of available colors appears.
Select the color you wish to change and the color appears in the cell of the Color column.
TheShow no report afterflag is a quality check for irregular time series datasets only. The default is that if more than one hour goes by without data being received, then aNo Report qualityflag is triggered. If you receive most of your irregular data in three-hour chunks, you may wish to increase this quality flag to three (3) hours.
Check the box next toShow no report after, and in the field type the number of hours you wish to use.
ClickOK, the Quality Color Bar Editor closes and the Map Window refreshes all of the quality color bars.