Forecast Tabs in the Modeling module provides easy access to commands and processes for the user. There are six tabs – Actions, Reports, Scripts, Icon Layers, Workflow, and Team. The Icons Layers tab, in the Modeling module, allows you to select attributes for the Time Series Icon Layer provides further details. The other five tabs contain information and/or commands based on whether you have selected a model alternative or an element of that model alternative. Further details on each forecast tab is provided in CWMS Forecasts.
Icons Layers Tab
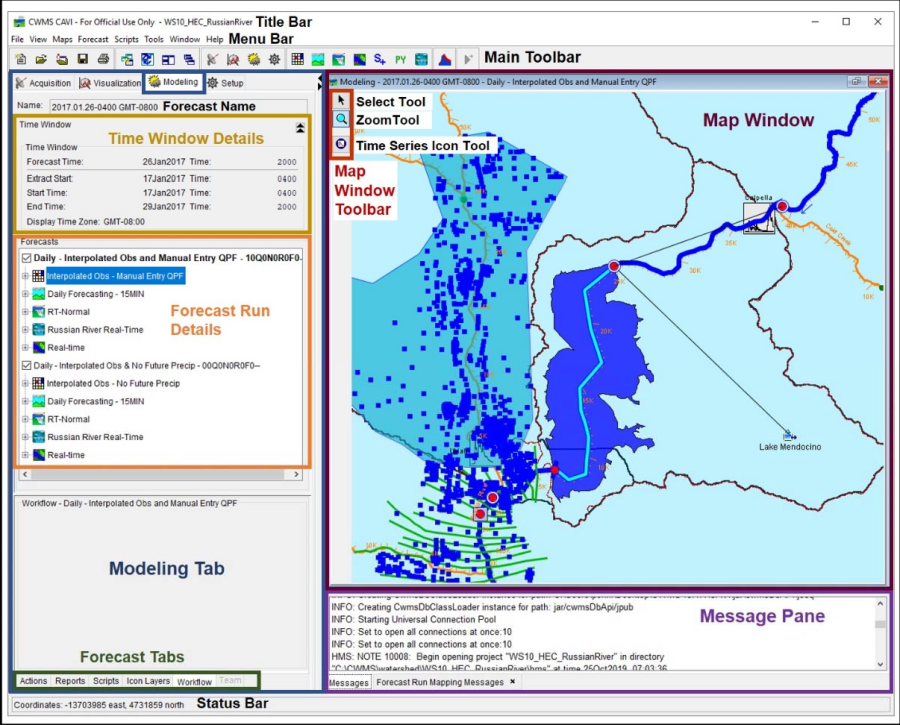
From the Forecast Tabs (Modeling Module), click the Icon Layers tab, the Time Series Icon Controls display (Figure 1). From the Time Series Icon Controls you can select the Time Series Icon Layer attributes that are displayed within the watershed. The Time Series Icon Controls are located on the Visualization, Acquisition, and Modeling tabs. There are three attributes available: Icons Type, Value, and Layer (Figure 1).

| Icons Type | forces all icons within the map window to display as the selected Icon Type in the list. Selecting the Default option in the list will display the icons as they were set originally during setup (Time Series Icons). |
| Values | allows you to display the time series icon's data as labels, which display next to or on the location of their associated time series icons. For example, you can choose to display the data's total, minimum, and maximums values as labels. Multiple values can be selected at once. |
| Layers | allows you to select the sub-layers that are visible in the map window. Multiple layers can be selected at once. |
By selecting the attributes, you can change how time series icons are displayed within the Modeling module. For more detailed information on how to configure the properties that control time series icons, see Time Series Icons.
Actions Tab
Like several other of the Forecast Tabs, the Action tab (Figure 2) is influenced by the user's choices in the Forecast Run Details area (Modeling Module). From the Forecast Run Details area, if you select a model alternative (HMS – Alternative 1), the Actions tab (Figure 2) displays the ability to compute the individual model alternative, and gives you access to several editors that are specific to the selected model alternative (e.g., HEC-HMS). This mean the user can make changes to the selected model alternative without having to go to the Setup module to make edits.
If the user expands (clicks +) the model alternative, a list of elements specific to that model alternative will display (e.g., source, reservoir, subbasin, etc.). For example, in Figure 2, you have selected Calpella (subbasin), from the Actions tab, an editor specific to that element type will display and you can make changes specific to that element. This means the user can make changes to the specific model alternative element without having to search the Map Window for the element to make edits.
Further details regarding the Action tab is available from CWMS Forecasts.
