A number of features have been included in ResSim to assist in analyzing the results from a Monte Carlo alternative. These features can be found in the Reports menu under Monte Carlo. They include:

  • Output Report—a text report generated by the Monte Carlo run that summarizes key aspects of the run including the number of iterations, the status of convergence, statistics on the input and output variables and a table showing the non-exceedance probability of the "values of interest" for each output variable ("Figure: Monte Carlo—Sample Output Report").

    Figure: Monte Carlo—Sample Output Report


  • Histogram Display—this "Report" includes a graphic showing a histogram of the selected input or output variable, sampling statistics, and parameter values ("Figure: Monte Carlo - Sample Histogram Display"). The displayed information may include the following (depending on which variable is selected):

    Figure: Monte Carlo - Sample Histogram Display

    • Number of Realizations (iterations),
    • Running Average,
    • Distribution Parameters (e.g., mean, standard deviation) specified for the variable's distribution,
    • Clipping limits.
    • Convergence Parameters (confidence, relative tolerance, relative error),
    • Flag Test Parameters
  • Convergence Plot—this "Report" is a plot of the Output Variable's statistic, the running average and error bounds on the statistic, and the convergence criteria on the variable ("Figure: Monte Carlo—Scalar Display showing Convergence").

    Figure: Monte Carlo—Scalar Display showing Convergence


In addition to the predefined Monte Carlo "reports", all the output generated by the run is stored in the simulation.dss file, so you can look for and find anything else you might need to analyze the results.

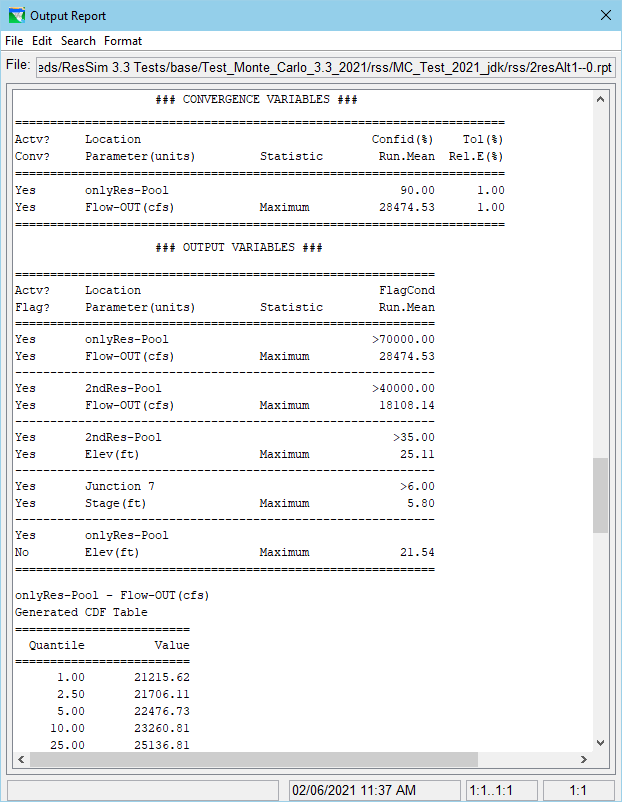
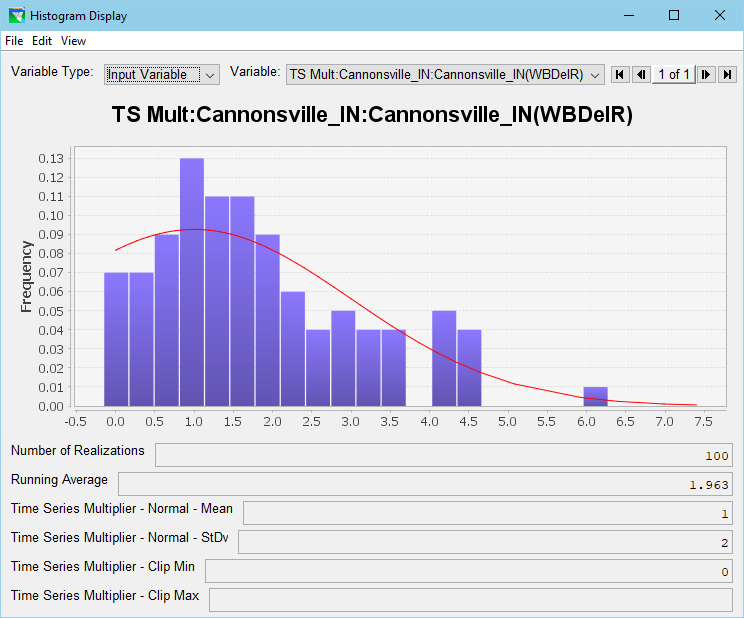
Note that the reports shown in this appendix do not contain meaningful results. They are merely screenshots to help familiarize the reader with the appearance of the features in the interface. Likewise, many of the figures depicting editors do not contain real data.