Download PDF
Download page Viewing Summary Reports.
Viewing Summary Reports
Summary Reports are available from the Reports menu. In all Summary Reports, the Simulation name and Alternative appear at the top of the window, along with the Lookback date and time, the Start date and time, and the End date and time.
Summary Reports also have two menus. The File menu allows you to Print and Close the report (see "Printing and Exporting ResSim Data" for information about printing). The Options menu lets you Specify the Time to review the simulation results for a single time period.
Reservoir Summary Reports
The Reservoir Summary Report ("Figure: Reservoir Summary Report") displays Average, Maximum, and Minimum result values for pertinent reservoir parameters.
To view the Reservoir Summary Report, select Reservoir Summary from the Reports menu.
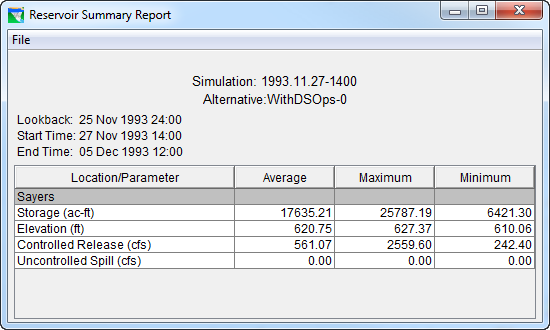
Figure: Reservoir Summary Report
Flow Summary Reports
The Flow Summary Report ("Figure: Flow Summary Report") displays Average, Maximum, and Minimum flow values for individual location parameters.
To view the Flow Summary Report, select Flow Summary from the Reports menu.
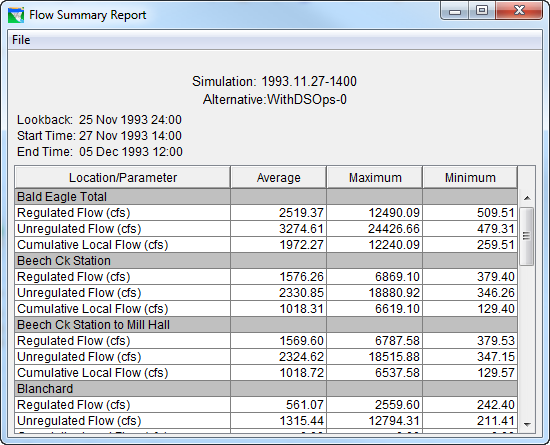
Figure: Flow Summary Report
Power Summary Reports
The Power Summary Report ("Figure: Power Summary Report") displays Average, Maximum, and Minimum values for individual location parameters.
To view the Power Summary Report, select Power Summary from the Reports menu.
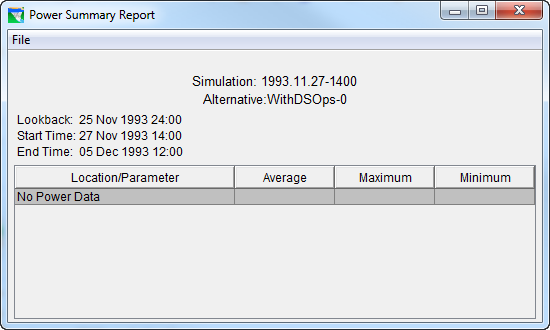
Figure: Power Summary Report
Gate Summary Reports
The Gate Summary Report ("Figure: Gate Summary Report") displays Average, Maximum, and Minimum values for individual location parameters.
To view the Gate Summary Report, select Gate Summary from the Reports menu.
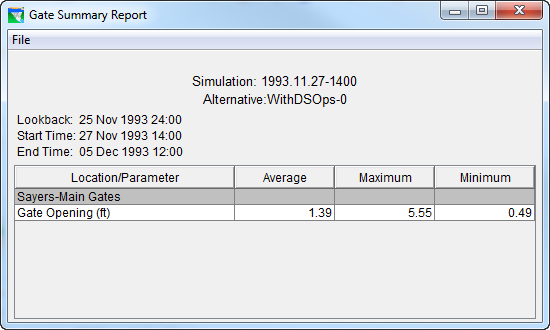
Figure: Gate Summary Report
Stage Summary Reports
The Stage Summary Report ("Figure: Stage Summary Report") displays Average, Maximum, and Minimum stage values for individual location parameters.
To view the Stage Summary Report, select Stage Summary from the Reports menu.

Figure: Stage Summary Report
Release Decision Reports
The Release Decision Report ("Figure: Release Decision Report") displays a reservoir's Active Zone, Elevation, and Net Inflow for each timestep of the simulation. It also gives the Active Rule and calculated release for the reservoir pool, dam, and outlets for each timestep.
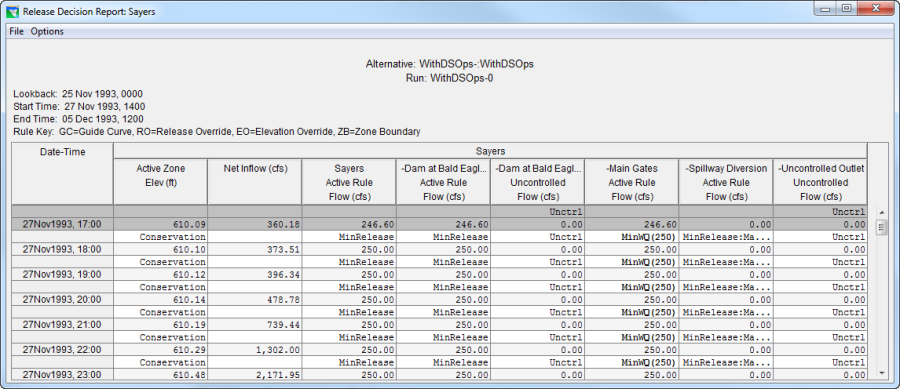
Figure: Release Decision Report
You can access the Release Decision Report by selecting Release Decision from the Reports menu. To go straight to a specific reservoir's Release Decision Report, select Release Decision Report from the reservoir's context menu (right-click the reservoir element).
The Release Decision Report File menu allows you to Print and Close the report.
The Options menu ("Figure: Release Decision Report Options") allows you to select a different reservoir for the report. It also gives you the option to select a time window—either the default of the entire simulation period, or a specific, shorter time window.
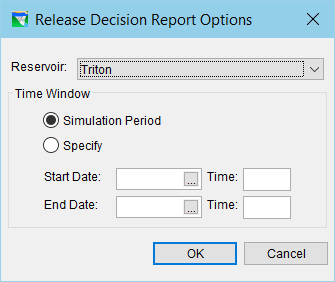
Figure: Release Decision Report Options
User Reports
The User Report editor provides you with the ability to create and edit user reports. User Reports make it possible to organize, manipulate, and display simulation results in customized tables. Output time series data specific to the current active alternative in the Simulation module is made available to the User Report editor.
To create, edit, or access User Reports:
From the Reports menu, select User Reports → Edit… ("Figure: Simulation Module - Reports Menu - Accessing the User Report Editor").
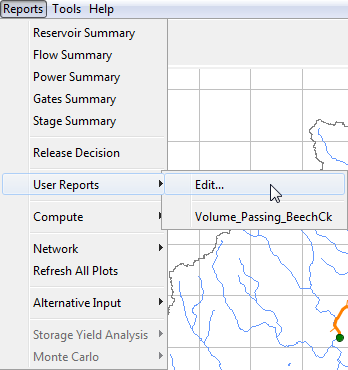
Figure: Simulation Module - Reports Menu - Accessing the User Report Editor
The User Report Editor will appear, as shown in "Figure: User Report Editor".

Figure: User Report Editor
Create a new report template by selecting New from the Report menu. The Create a New Report Template tool
 (located in the upper left-hand corner of the editor) can also be used for creating a new report. The Create New Report Template dialog will appear ("Figure: Create a New Report Template") where you will give your report a Name and Description and select OK.
Figure: Create a New Report Template
After creating a new report template ("Figure: User Report Editor - After Creating a New Report Template"), you will notice four tabs in the User Report Editor: Contents, Options, Report Header/Footer, and Page Header/Footer.

Figure: User Report Editor - After Creating a New Report Template
From the Contents tab select Edit to choose the output time series that you would like to include in your first report block. The Report Content Selection dialog will appear ("Figure: Report Content Selection").
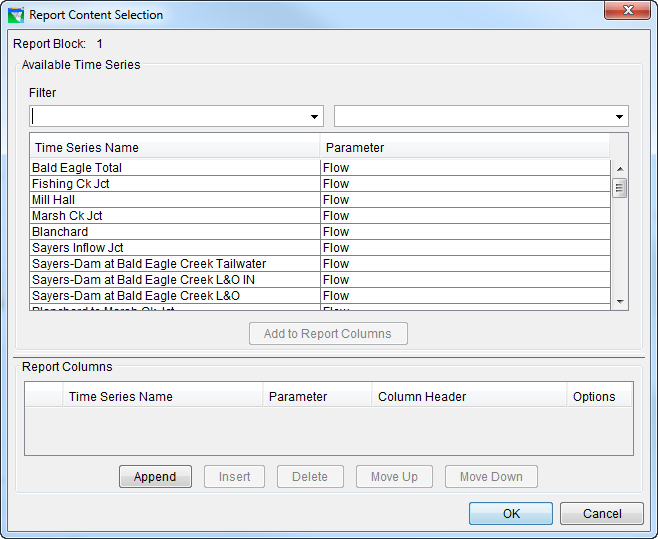
Figure: Report Content Selection
- To add a time series, highlight the Time Series Name and select Add to Report Columns. Each time series that is added will be represented as its own column in the current report block. As mentioned previously, only output time series data from the current active alternative in the Simulation module is available for report building.
"Figure: Report Content Selection - Time Series Added to Report Columns" is a display of the Report Content Selection dialog after two time series have been added to the report block under construction.
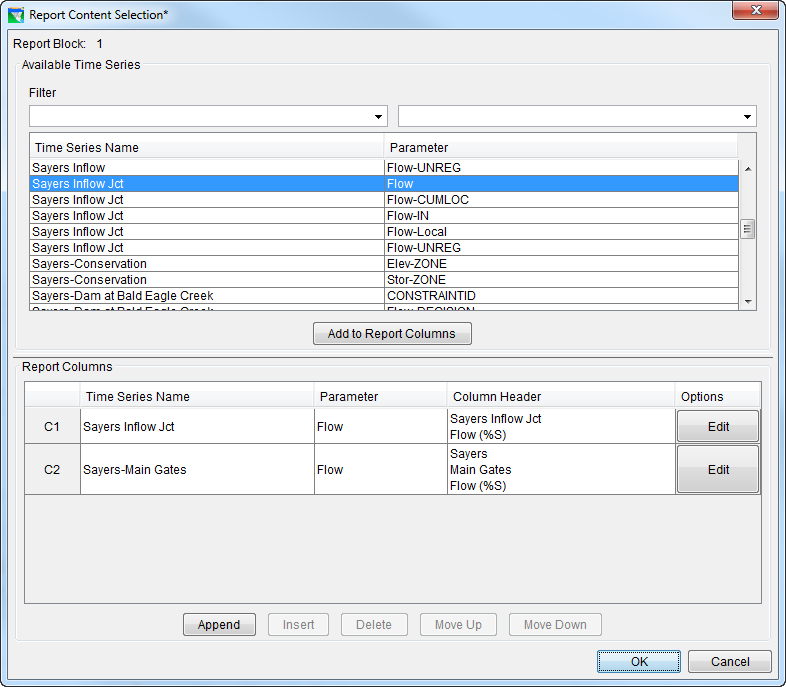
Figure: Report Content Selection - Time Series Added to Report Columns
All elements in the Report Columns area of the Report Content Selection dialog are editable. To edit Time Series Name, Parameter, or Column Header, double click on the desired cell and make the appropriate changes.
Units for column headings can either be entered in manually or using the character string code %S. Typing this into the column header box (as shown in "Figure: Report Content Selection - Time Series Added to Report Columns") will result in the units automatically being displayed in the report. Note that the code is case sensitive.
The buttons at the bottom of the Report Columns area, Append, Insert, Delete, Move Up, and Move Down, can be used to add columns to the report and rearrange time series data into different columns. Append will add a blank column to the far-right side of the report (a row will be added to the template). Insert will add a blank column to the left of the column in the report that is selected in the Report Columns area (a row will be added before the selected row in the template). Delete will erase from the report whatever column is selected in the Report Columns area (the selected row in the template will be deleted). Move Up and Move Down will shift the selected column to the left and right in the report, respectively (the row in the template will shift up or down).
Select the Edit option to manipulate the time series data in each column. Doing so will bring up the Report Column Options dialog ("Figure: Report Column Options"). The title bar at the top of the dialog will include the column currently being edited (in this case, C1). The Report Column reflects the contents of the Column Header (in this case, SAYERS INFLOW JCT FLOW (%S)).
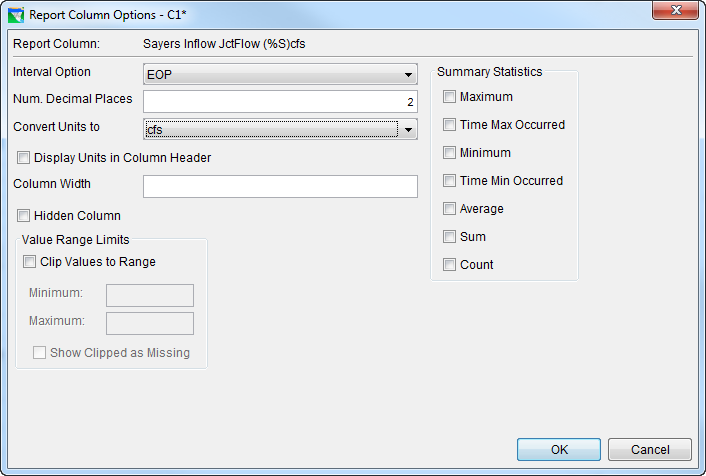
Figure: Report Column Options
For Interval Option, you are given four choices as to how you would like your data to be defined for each point in time: SOP (Start of Period), EOP (End of Period), PAVG (Period Average), and PCUM (Period Cumulative). This gives you the ability to specify what type of data is actually being reported for each time interval.
The number of decimal places reported for the time series can also be specified with Num. Decimal Places.
Units Multiplier (prefix) can be used to select a multiplier (1, 1000, or 1000000) that will be applied as a "prefix" to the units of the data reported in the column being reported. For example, you might choose 1000 to convert KW units to MW units. The data values will be divided by 1000 and the units label will be preceded by 1000 (e.g., 1000 KW). For example, for a value of 2526 KW, then the value displayed in the report column will change to 2.526 and the Units should reflect 1000 KW. Currently, however, the multiplier value is not automatically displayed in the column header. Therefore, you must manually enter the multiplier into column headings wherever appropriate. Note: it also might be appropriate to increase the number of Decimal Places (see previous paragraph) when using this option for displaying units.
The Column Width can also be specified. To manually enter a desired width, enter the number of characters wide that you would like your column to be in the Column Width box.
Checking the Hidden Column box will effectively prevent the column from being visible in the report. Selecting this option only prevents the column from being seen. The time series data, and all edits to the column, will still be attached to the report.
It is possible to withhold data that does not fall within a certain specified range by checking the Clip Values to Range box. After checking the box, specify the range (outside of which the data will not be shown) by entering the Minimum and Maximum values. Furthermore, you can check the Show Clipped as Missing box, which will replace the clipped data with either "M", "M", or a blank space. See options from the View menu of the User Report as subsequently discussed in Step 8.
The right side of the Report Column Options dialog contains Summary Statistics that can be calculated for the time series data in the current column being edited. These statistics include the following: Maximum, Time Max Occurred, Minimum, Time Min Occurred, Average, Sum, and Count. The statistics that are chosen to be calculated will be shown in the report at the bottom of the column.
Once all edits have been made to the column, select OK to save and return to the Report Content Selection dialog (previously shown in "Figure: Report Content Selection"), or select Cancel, which will return you to the Report Content Selection dialog and ignore all column edits you just made. In the Report Content Selection dialog, select OK to save all edits and return to the User Report Editor. Selecting Cancel will return you to the User Report Editor (previously shown in "Figure: User Report Editor - After Creating a New Report Template") but will not save any edits you made to the report block.
In the User Report Editor, select the Options tab (as shown in "Figure: Report Column Options").
By using the dropdown menu for Reporting Interval, you can select which report interval you would like to use. You can select Each Step, Daily, Weekly, Monthly, or Yearly. When choosing Daily, Weekly, Monthly, or Yearly, it will be necessary to specify what hour, day, or month you would like to report. For instance, if a daily reporting interval is used, you will need to choose which hour of the day you would like reported. When Each Step is chosen, data will be reported for all intervals, so it is not necessary to specify reporting hours, days, or months.
Default Minimum Column Width can also be specified. In the box to the right, column width, expressed in pixels, can be set to whatever value you find appropriate. The default column width is set to 100 pixels. You can increase the column width, but the minimum width will be at least 100 pixels (even if you enter a value less than 100).
In the bottom left corner are the Date/Time Column options which can be used to specify how you would like time to be reported. Choosing Start of Period will display the time at the start of each interval that data is reported. Choosing End of Period will display the time at the end of each interval, and choosing Both will display the beginning time and ending time of each interval. You can also check Show Time, which will display the hour of day for each time interval, and Show Day of Week, which will display the day of week for each time interval.
In the bottom right corner are the Report Size and Location options that can be used to specify how large you would like your report to be and where on the screen you would like it to appear. The size of your report can be set by entering dimensions (in pixels) in the Report Size (w×h) boxes. Furthermore, you can set the location where the report will appear on your computer screen by entering coordinates (in pixels) in the Report Screen Location (x,y) boxes. These screen coordinates should correspond to an origin based on the upper left hand corner of your computer screen (i.e., an "x, y" coordinate of "1, 1" would place the upper left corner of your User Report in the upper left corner of your computer screen). Since this display control affects the report both when it is displayed on the screen and when it is printed, you should only use this option when you are not printing the report.
Select the Report Header/Footer tab in the User Report Editor to give your report a title, header, and footer, if desired ("Figure: User Report Editor - Report Header/Footer Tab").
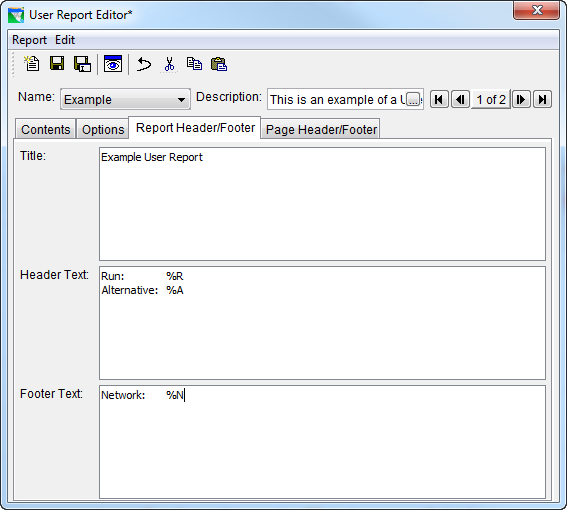
Figure: User Report Editor - Report Header/Footer Tab
The Title and Header Text will appear at the beginning of the report, while the Footer Text will appear at the end. Notice the character string codes (%) entered in "Figure: User Report Editor - Report Header/Footer Tab". These codes refer to run name (%R), alternative name (%A), and network name (%N), respectively.
"Table: User Reports - Character String Codes" provides a list of the character string codes (which are case sensitive) that can be used to allow automatic viewing of special text fields in the report where text can be added or edited and in the Report Header & Footer.
Table: User Reports - Character String Codes
%R | Run name |
%A | Alternative name |
%N | Network name |
%L | Lookback time |
%B | Simulation Beginning (or start) time |
%E | Simulation End time |
%V | Build Version |
%S | Units |
Select the Page Header/Footer tab in the User Report Editor to add a header and footer to the page of your report, if desired ("Figure: User Report Editor - Page Header/Footer Tab").
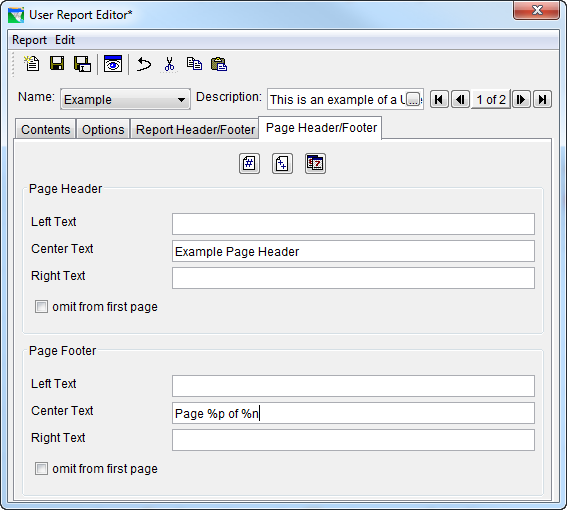
Figure: User Report Editor - Page Header/Footer Tab
Instead of inserting a header and footer at the beginning and end of the report, a header and footer will be inserted at the top and bottom of each printed page. "Table: User Reports - Character String Codes for Header/Footer" provides a list of the character string codes (which are case sensitive) that can be used to allow automatic viewing of special text fields in the page header and/or footer.
Table: User Reports - Character String Codes for Header/Footer
%d | Date report is printed |
%p | Page number |
%n | Number of pages |
The three tool buttons located above the Page Header options can be pressed to insert the following codes (instead of manually typing in the %code): ![]() Add the page number (%p)
Add the page number (%p)![]() Add the total pages (%n)
Add the total pages (%n)![]() Add the current date (%d)
Add the current date (%d)
If you do not want the Page Header and/or Footer information to appear on the first page of your report, you can check the box labeled omit from first page.
- In the User Report Editor, use the Save and View Report tool
 to save your report template to disk and see a preview of your User Report.
A User Report contains the following menus:
Report: Options include Save As…, Print, and Close ("Figure: User Report - Report Menu").
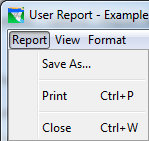
Figure: User Report - Report Menu
View: Options include Show Missing As (blank, M, M) and Show Commas (as shown in "Figure: User Report - View Menu").
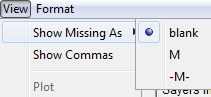
Figure: User Report - View Menu
Format: Options include Font (for Title, Header, Footer, and Tables) and Save Settings (as shown in "Figure: User Report - Format Menu").
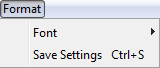
Figure: User Report - Format Menu
"Figure: User Report Preview" shows the "Beginning" (top of figure) and "End" (bottom of figure) of the Example User Report (note the report title, header, and footer as well as the statistics printed at the end of each column).

Figure: User Report Preview
To add another report block, return to the User Report Editor. Under the Contents tab, select Add to insert another report block. Add one or more time series to the new report block using methods previously discussed and make desired edits to the newly created columns. Each report block can be given a title in the Label column in the Report Blocks area of the User Report Editor. "Figure: User Report Editor - Contents Tab - User Report Template with Two Report Blocks" shows the User Report Editor with two report blocks. In this example, the two labels Block 1 and Block 2 were entered for illustration purposes.
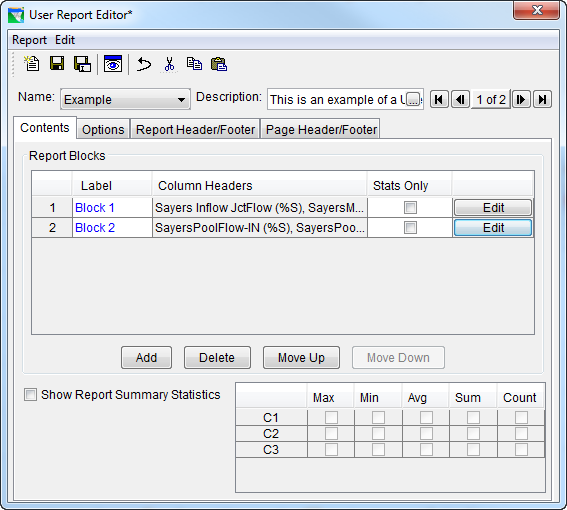
Figure: User Report Editor - Contents Tab - User Report Template with Two Report Blocks
 "Figure: User Report with Two Report Blocks" shows a preview of the User Report after adding the second report block. Note that the labels assigned in the User Report Editor appear above the time column.
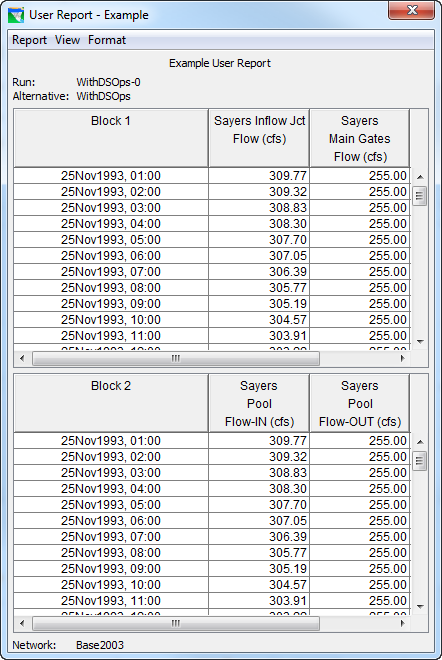
Figure: User Report with Two Report Blocks
- Be sure to save your user report template after you have made all necessary edits. If you have not used the
 tool after making your final edits, then be sure to save your User Report template using one of the following options:
You can use the tools available in the toolbar located near the top of the User Report Editor:
 Save the Current Report Template using the current name.
 Save the Current Report Template under a new name which will bring up a separate dialog that allows you to specify a new Name and Description for your report template.
You can also choose to use the Save commands available from the Report menu of the User Report Editor, as shown in "Figure: User Report Editor - Report Menu".
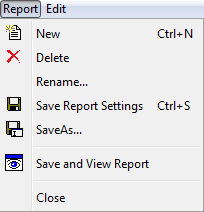
Figure: User Report Editor - Report Menu
Completed and saved User Reports can be directly accessed in the Simulation module from the Reports menu. Select Reports → User Reports to view a list of current user reports ("Figure: Simulation Module Reports Menu - Accessing Saved User Reports"). In this example, the new user report created for this watershed is named "My_User_Report." Selecting "My_User_Report" will bring up the User Report previously shown in "Figure: User Report Preview"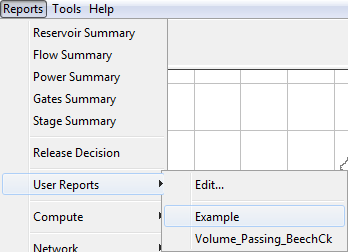
Figure: Simulation Module Reports Menu - Accessing Saved User Reports
Network Reports
The Reservoir List, Reach List, Junction List, Diversion List, and the Network Connectivity Summary report are also available from the Reports menu → Network option of the Simulation Module. Refer to "The Reservoir Network Reports".