If the quality color bar or thumbnail plot for a location indicates that the data is questionable or bad, viewing the data in a table can help you to determine the nature of the issue. To access tables of data:
- From the Map Window, right-click a time series icon, from the shortcut menu, click Tabulate.
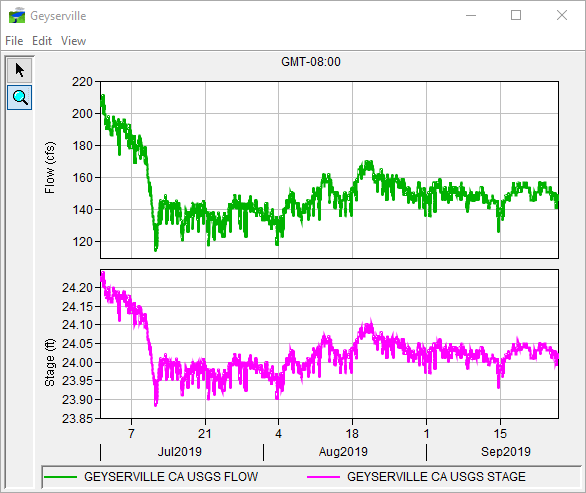
- This opens a table that contains data for that location for the current time window. Figure 1 shows a sample table of the data for a flow and stage gages.

- If you have already opened a plot, you can also tabulate the data displayed in the plot from the Plot dialog (Sample HEC-RTS Plot). From the File menu, click Tabulate. For more details on tabular data in HEC-RTS, see Visualizing Data. For printing and exporting tabular data, see Printing and Copying HEC-RTS Data.