To create time series icons layers:
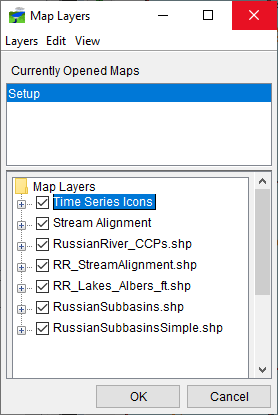
- From the HEC-RTS main window, click on the Setup tab, from the Maps menu, click Map Layers. The Map Layers dialog will open. From the Map Layers tree, right-click on the Time Series Icons layer. From the shortcut menu (Figure 1), click Add Icon Layer, the New Time Series Icon Layer dialog opens (Figure 2).


- In the Name field (Figure 2), type a name for the time series icon layer. For example - Flow, Stage, or Precip.
- In the Description field (Figure 2), type an optional description for the timer series icon layer.
- You can add all of the time series icons that you defined for the watershed to the newly created time series icon layer, by selecting Add all Time Series Icons' Data Sets to this Layer (Figure 2). You should only do this if the time series icons are of the type that the time series icon layer represents. By default, all icons are part of the "All" time series icon layer. For more detail on how to add individual time series icons to timer series icon layers, refer to Time Series Icons.
- Another way to create time series icon layers, from the Setup module, from the Map Window, select the Time Series Icon Tool (
 ) or the Select Tool (
 ), right-click on a time series icon, from the shortcut menu, click Edit. The Time Series Icon Editor will open, click on the Icon Types and Layers tab (Figure 3).

- From the Layers box (Figure 3), click Add. The New Time Series Icon Layer dialog will open (Figure 2). Repeat Steps 2 through 4 to create a time series icons layer.
- Click OK, and the New Time Series Icon Layer dialog will close (Figure 2).
When you are done creating time series icons layers, you can assign datasets from a selected time series icon, to individual time series icons layers (for more details on how to configure time series icons see Time Series Icons).