Precipitation Grid Sets
A grid set can be thought of as a sequence or time series of grids. Since a single DSS record of grid data contains data for only a one-time interval, you must create grid sets before you can view the precipitation grids changing through time over the watershed. Grid sets are created by HEC-GridUtil.
Add a Grid Set
Once a grid set has been created for a watershed, you can add it to the Visualization Module for viewing in the Map Window.
To add a grid set to the watershed:
- From the HEC-RTS main window (Visualization Module), from the Data Visualization menu, point to Gridded Data, from the menu click New Grid Set (Figure 1).

- The Create New Grid Set dialog will open (Figure 2). In the Name box enter a name for the grid set. A description for the grid set is optional and can be entered in the Description box (Figure 2).

- Click OK, the Create New Grid Set dialog will close (Figure 2), and the Edit Grid Set dialog will open (Figure 3).

- Click Add File(s), an Open browser will open. Navigate to the location where available precipitation grids are. Click on a grid set (precip.yyyy.mm.dss), click Open, the Open browser will close, and the pathname and the filename will display in File List (Figure 3).
- From the Grid Set Identifier box (Figure 3), you will need to select the individual identifiers from the available lists (i.e., Grid Type (A-Part); Location (B-Part), etc.). You also need to select the time interval from the Time Interval list (Figure 3). Click OK, the Edit Grid Set dialog will close. From the GriddedData menu (Figure 1). the name of the grid set that was just created will display.
Delete a Grid Set
To delete a grid set from the watershed:
- From the HEC-RTS main window (Visualization Module), from the Data Visualization menu, point to Gridded Data, from the menu click Delete Grid Sets (Figure 1).
- The Delete Grid Sets dialog will open (Figure 4). From the Existing Grid Sets list, select the grid sets that you wish to delete; the name(s) of the grid set will display in the Name box (Figure 4).

- Click Delete, a Warning window will display, asking you if you really want to delete the selected grid set, click Yes. The Warning window and the Delete Grid Sets dialog (Figure 4) will both close. The grid set will no longer display in the Gridded Data menu (Figure 1) and will be removed from the watershed.
Selecting a Grid Set
To select a grid set:
- From the HEC-RTS main window (Visualization Module), from the Data Visualization menu, point to Gridded Data. From the menu (Figure 1), at the bottom of the menu, the names of the grid sets that have been added to the watershed are displayed, along with None.
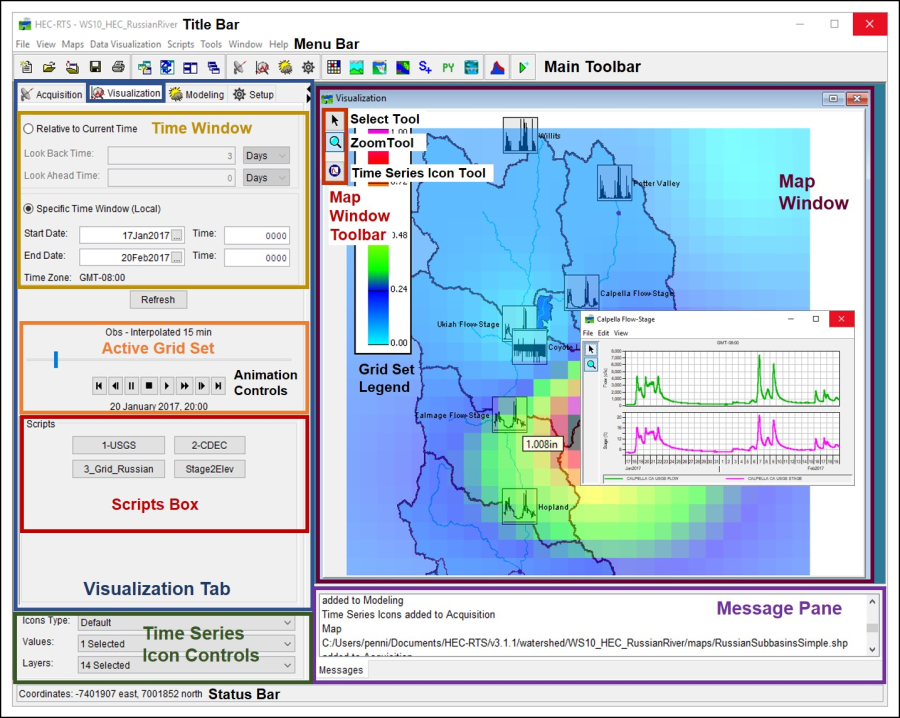
- To select a grid set for viewing in the Visualization module, click on the grid set name (e.g., FebGrids). The name of the selected grid set will display in the Active Grid Set section of the HEC-RTS main window (Visualization Module). Also, the Animation Controls will become active, and the Grid Set Legend will display in the Map Window (Visualization Module).
- To unselect a grid set, from the Gridded Data menu (Figure 1), click None.
Properties of a Grid Set
You can control the visibility and color scheme of the grid set through the Map Layers dialog (Understanding Layers). In the Visualization module, the Map Layers dialog (Figure 5) displays the selected grid set layer, from which you can edit various properties of the grid set. These properties include color scheme, tic intervals, and the minimum/maximum values for the contour.

Changing a grid set's properties:
- From the Maps menu, click Map Layers and the Map Layers dialog (Figure 5) opens. From the tree, right-click on the grid set layer name (FebGrids), from the shortcut menu, click Properties. The Grid Display Options dialog (Figure 6) opens.

- The name of the active grid set is displayed at the top of the Grid Display Options dialog.
- From the Properties tab (Figure 6), the list at the top left contains six pre-set color contour schemes, with the default being Precipitation.
- From the Tic Interval box (Figure 6), you can set the tic interval for the selected grid set.
- In the Contour Limits box (Figure 6), you can set the minimum and maximum contour values for the selected grid set. By default, HEC-RTS automatically determines the minimum and maximum contour values. If you wish to enter these values manually, clear System Specified Min/Max Values. Then enter values in the Maximum and Minimum boxes.
- For other settings to adjust, click Advanced. The Grid Display Options dialog expands (Figure 7) to include options for brightness, saturation, transparency, aspect shading, maximum clipping, and minimum clipping.

- You can control the Brightness (the amount of white, measured from 0.0 to 1.0), Saturation (the amount of black, measured from 0.0 to 1.0), and Transparency (the level of opacity or alpha, measured from 0.0 to 1.0) of your gridded data layer either by moving the sliders or by typing values into the white text fields. The color scale to the right will update according to your selections.
- If you are using elevation maps, you may wish to choose Aspect Shading as your color contour scheme. Use the Aspect Shading option to make the elevation map appear in relief by placing an imaginary light source above the map and shading the elevation contours. When the Aspect Shading option is selected, you can use the Angle slider to adjust the angle of the light source.
- By default, the Maximum Clipping and Minimum Clipping options are deselected. If you activate these options, the Value sliders and Color buttons become available. The Value sliders allow you to specify the amount of clipping within the contour limits you have specified; you can also type values into the boxes. When you click on the Color buttons, the Color Chooser appears, for more information on the Color Chooser see Using the Color Chooser.
Visualization Scale of a Grid Set
To set the visualization scale for a grid set:
- From the Maps menu, click Map Layers, the Map Layers dialog (Figure 5) opens. From the tree, right-click on the grid set layer name (FebGrids), from the shortcut menu, click Properties. The Grid Display Options dialog (Figure 6) opens.
- Click the Scale tab (Figure 8). Both zoom-in and zoom-out scale factor can be set from the Grid Display Options dialog. By default, the Gridded Data Layer is set for Always show layer. To see visualization scales, click Only show layer in the following scale range.

- To set the scale so that the gridded data layer becomes visible as you zoom-in, you can set the scale to the current scale by clicking Set to Current. If you wish to enter a value, from the Only visible below 1 field, enter the scale factor.
- To set the scale so that the gridded data layer becomes visible as you zoom-out, you can set the scale to the current scale by clicking Set to Current. If you wish to enter a value, from the Only visible above 1 field enter the scale factor.
- Click OK, the Grid Display Options dialog (Figure 8) closes, and the visualization scale is set for the gridded data layer.
Another way to set the visualization scale for a grid set:
- From the HEC-RTS main window (Visualization Module), from the Data Visualization menu, point to Gridded Data, from the menu click Edit Grid Set (Figure 1).
- An Open dialog will open (like Figure 4). From the Existing list, select a grid set, click Open. The Open dialog will close, the Edit Grid Set dialog will open (Figure 3).
- From the Set display scale limits box (Figure 9), you can set the minimum and maximum scale values for the selected grid set.
