The Dashboard in HEC-RTS is a customizable workspace designed to support efficient forecasting workflows. It allows you to create and manage multiple Configurations, each tailored to specific tasks or user preferences. Configurations are accessible via a dropdown menu in the ribbon, enabling quick switching between different setups.
Within each configuration, you can add and organize widgets—interactive panels that display forecast data, model results, and other relevant information. The layout is highly flexible: widgets can be arranged as tabs or displayed side-by-side within a single view.
The Dashboard also features a toolbar for quick access to common actions like adding widgets, saving configurations, and refreshing data. You can further personalize the Dashboard by customizing the toolbar and arranging actions to suit your workflow.
With these features, the Dashboard serves as a centralized, adaptable interface for managing and visualizing forecast data in HEC-RTS.

Accessing the Dashboard
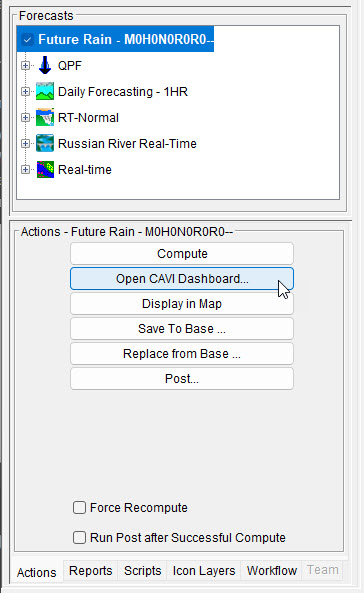
To access the Dashboard, open a forecast within the Modeling tab, select a forecast alternative, navigate to the Actions tab, and click the Open CAVI Dashboard button.

Customizing the Dashboard
The Dashboard is fully customizable and includes five types of widgets:
- Map Panel - Displays a watershed map.
- Model Actions - Integrates forecast-related functionality from the Actions tab in the Modeling module.
- Plot Panel - Visualizes time series data in graphical format.
- Tabulate Panel - Presents time series data in tabular format.
- Text Block - Displays formatted text, including HTML content.
Additional Resources
Refer to the Working with Dashboards set of guides to learn more.